Download
1 / 2
20 likes | 157 Views
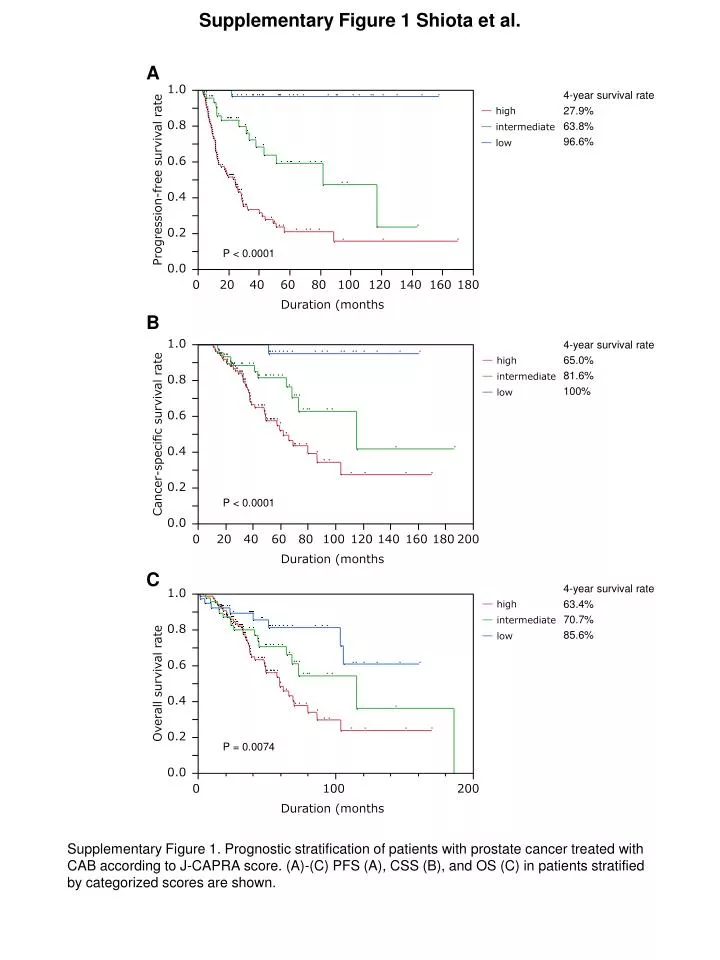
Supplementary Figure 1 Shiota et al. A. 4-year survival rate 27.9% 63.8% 96.6%. P < 0.0001. B. 4-year survival rate 65.0 % 81.6% 100%. P < 0.0001. C. 4-year survival rate 63.4% 70.7% 85.6%. P = 0.00 74.

E N D
Supplementary Figure 1Shiota et al. A 4-year survival rate 27.9% 63.8% 96.6% P < 0.0001 B 4-year survival rate 65.0% 81.6% 100% P < 0.0001 C 4-year survival rate 63.4% 70.7% 85.6% P = 0.0074 Supplementary Figure 1. Prognostic stratification of patients with prostate cancer treated with CAB according to J-CAPRA score. (A)-(C) PFS (A), CSS (B), and OS (C) in patients stratified by categorized scores are shown.
1.00 1.00 0.75 0.75 Sensitivity 0.50 Sensitivity 0.50 0.25 0.25 1996-2005ROC area: 0.895 2006-2012 ROC area: 0.876 0.00 0.00 0.00 0.25 0.50 0.75 1.00 0.00 0.25 0.50 0.75 1.00 1-Specificity 1-Specificity 1.00 1.00 0.75 0.75 Sensitivity 0.50 0.50 Sensitivity 0.25 0.25 0.00 0.00 0.00 0.25 0.50 0.75 1.00 0.00 0.25 0.50 0.75 1.00 1-Specificity 1-Specificity Supplementary Figure 2 Shiota et al. Prediction of PFS using continuous J-CAPRA score Prediction of PFS using categorized J-CAPRA score P = 0.7444 P = 0.2251 A B Prediction of CSS using continuous J-CAPRA score Prediction of CSS using categorized J-CAPRA score 1996-2005ROC area: 0.886 2006-2012 ROC area: 0.812 P = 0.2533 P = 0.3371 1996-2005ROC area: 0.879 1996-2005ROC area: 0.821 2006-2012 ROC area: 0.803 2006-2012 ROC area: 0.759 Supplementary Figure 2. Validation of J-CAPRA score. Receiver operator characteristic curves of J-CAPRA score (left panel, continuous scores; right panel, categorized scores) among patients in 1996-2005 and 2006-2012 for the prediction of PFS (A) and CSS (B). The curves describe the association between sensitivity and specificity.


![[ Maritime Multi-hop Networks ] Document Number: C802.16gman-10/0001 Date Submitted: 2010-01-08 Source: Dr Jaya Shankar](https://cdn0.slideserve.com/71962/slide1-dt.jpg)