Download
1 / 24
240 likes | 321 Views
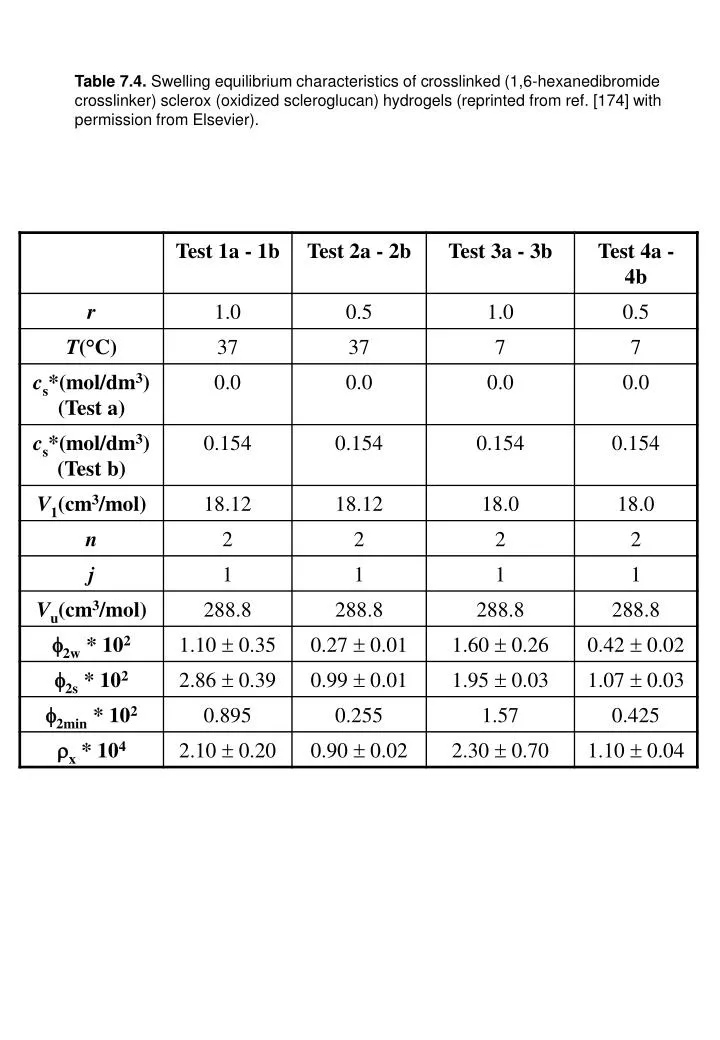
Table 7.4. Swelling equilibrium characteristics of c rosslinked ( 1,6-hexanedibromide crosslinker ) sclerox (oxidized scleroglucan) hydrogels (reprinted from ref. [174] with permission from Elsevier).

E N D
Table 7.4. Swelling equilibrium characteristics of crosslinked (1,6-hexanedibromide crosslinker) sclerox (oxidized scleroglucan) hydrogels (reprinted from ref. [174] with permission from Elsevier).
Figure 6.19. While the Flory interaction parameter c is strongly dependent on f2min, the network croosslink density rx is virtually independent on f2min. In addition, rx and c simultaneously assume a physically consistent value only when 0.82*10-2 < f2min < 0.97*10-2 (with permission from ref [173]).
Table 7.5. Characteristics of the four sodium starch glycolates considered (CLV, LOW PH, V 17 and EXPLOTAB) (adapted from ref. [157]).
Figure 6.20. Dimensionless amount of solvent absorbed (Mt+) versus the the square root of the dimensionless time t+ for different Deborah numbers De assuming Rd = 10, Ceq = 0.2 g/cm3, g = 14 cm3/g and k = 12 cm3/g (with permission from ref [72]).
Figure 6.21. Comparison between CRS model prediction and those coming from its improved form considering two different Deborah numbers ( De1, De2). Mean Deborah number is, in all cases, equal to 5.005. Simulations are performed assuming Rd = 100, Ceq = 0.2 g/cm3, g = 14 cm3/g and k = 12 cm3/g.
Figure 6.22. Effect of different Deborah number distributions (d1: si = 100, 2.9, 0.023, 10-3, 3.7* 10-7, 1.34*10-9, 4.8*10-12, 1.72*10-14; d2: si = 100, 43, 29, 23, 19, 16, 14, 12; box-type d3: si = 100 for all i) on the dimensionless amount of absorbed solvent Mt+. Simulations are performed assuming Rd = 100, Ceq = 0.2 g/cm3, g = 14 cm3/g and k = 12 cm3/g.
Figure 6.23. Thermoreversible N-isopropylacrylamide copolymer swelling/deswelling kinetics (SR is the swelling ratio while t is time). While the CRS model has been fitted on swelling data (increasing part of the solid curve), the subsequent curve portion represents model prediction of deswelling kinetics. Both model data (open circles) fitting and prediction are satisfactory (with permission from ref. [209]).
Figure 6.24. Model (eq. 6.168) best fitting on hydrocortisone permeation through thermoreversible N-isopropylacrylamide copolymer membrane undergoing temperature step variations (with permission from ref. [209]).
Personal Computer AMBIENTE DI RILASCIO SPETTROFOTOMETRO POMPA PERISTALTICA AGITATORE PARTICELLE
APPARATO DI CINETICA DI SOLUBILIZZAZIONE IN CONTINUO CON LETTURA A FIBRA OTTICA
To the detector Light beam Measuring compartment Prism Mirror
Table 7.6. Values of the preset and fitting parameters relative to MAP and TEM release (reprinted from ref. [83] with permission from Elsevier).
DISTRIBUZIONE DEL FARMACO NELLA MATRICE Distribuzione di Lee
Figure 6.27. Comparison between model best fitting (solid line) and medroxyprogesterone acetate (MAP) release data (open circles) from polydispersed crosslinked polyvinil-pirrolidone particles. While vertical bars indicate standard error, dotted line represents model prediction about the volume of absorbed solvent Vsp (with permission from ref. [83]).
Figure 6.28. Comparison between model best fitting (solid line) and Temazepam (TEM) release data (open circles) from polydispersed crosslinked polyvinil-pirrolidone particles. While vertical bars indicate standard error, dotted line represents model prediction about the volume of absorbed solvent Vsp (with permission from ref. [83]).
Figure 6.29. SEM pictures of pellets size fractions: 2000 mm (a); 1250 mm (b); 800 mm (c); 630 mm (d); < 630 mm (residual) (e) (with permission from ref. [47]).
Acido Stearico 20% Lattosio 20% Paracetamolo 60% 630 800 1250 2000 RILASCIO IN AMBIENTE ACQUOSO (0.2M NaCl/0.2M HCl pH 1.2) TEMPERATURA = 37°C
CLASSE 1: 2*Rp = 2500 mm De= 1.7*10-4 cm2/min Kt= 12 cm/min Figure 6.30. Comparison between model best fitting (solid line) and experimental paracetamol release
CLASSE 2: 2*Rp = 1625 mm [1300 mm] De= 1.7*10-4 cm2/min Kt= 12 cm/min
CLASSE 3: 2*Rp = 1025 mm De= 1.7*10-4 cm2/min Kt= 12 cm/min
CLASSE 4: 2*Rp = 715 mm [540 mm] De= 1.7*10-4 cm2/min Kt= 12 cm/min
CLASSE 5: 2*Rp = 315 mm De= 1.7*10-4 cm2/min Kt= 12 cm/min
Figure 6.32. Comparison between model prediction (solid line) and experimental paracetamol release relative to a system composed by all pellets fractions (particle size composition: w2000 = 0.153, w1250 = 0.159, w800 = 0.210, w630 = 0.160, wresidual = 0.319 (circles) (adapted from ref. [47]).
TORTUOSITA’ NELLE SFERETTE De= Dw *e/t Dw = 7.1*10-4 cm2/min t = 0; e0 t > 0; e e0 e = 0.17 t = 3.1 e = 0.74 t = 0.7 t = 1.9