Download
1 / 60
600 likes | 760 Views
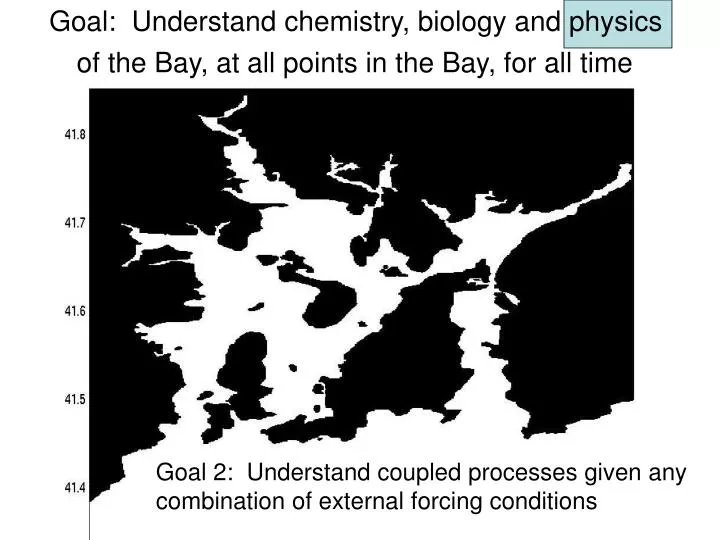
Goal: Understand chemistry, biology and physics of the Bay, at all points in the Bay, for all time. Goal 2: Understand coupled processes given any combination of external forcing conditions. Physics: Goal of Characterizing Circulation, Mixing, Stratification Flushing,

E N D
Goal: Understand chemistry, biology and physics of the Bay, at all points in the Bay, for all time Goal 2: Understand coupled processes given any combination of external forcing conditions
Physics: Goal of Characterizing Circulation, Mixing, Stratification Flushing, Transport, etc Tides Winds Runoff Density events Etc. vs Forcing Response Methods are Observations & Modeling
Key physical processes • Flushing dynamics • Transport and mixing • Deep water resupply
Goal: Understand chemistry, biology and physics of the Bay, at all points in the Bay, for all time RETENTION - MIXING/TRANSPORT - RESUPPLY
Use ADCP Data for Model Calibrations • ADCP deployment in Providence River Narragansett Bay Comm. x x Deployed July 7, 2005
Use ADCP Data > RETENTION GYRE • ADCP deployment in Providence River x x Deployed July 7, 2005
Flow in East Passage Flow out West Passage
Flow in East Passage Flow out West Passage Good or Bad? Good
How is deep return flow partitioned? Flow in East Passage Flow out West Passage Good or Bad? ? Good
Narragansett Bay hydrodynamic modeling Kincaid, Ullman, Bergondo, Pfeiffer-Herbert, Balt, La Sota, Rogers Funding: GSO-URI, Rhode Island Sea Grant, EPA-TMDL, Vetillson Foundation, Narragansett Bay Commission, NOAA Hypoxia
Numerical Model Initial Conditions Forcing Conditions ROMS Model Conservation Equations 3D T, S, Velocity Regional Ocean Modeling System Output
ROMS history • Providence River • Developed by D. Bergondo • N. La Sota’s thesis • 2. NB-RIS • J. Roger’s thesis • 3. Narragansett Bay • D. Ullman, C. Kincaid • & J. Rogers
Use Large Model to Drive Full Bay Model Tides & Currents from Newport ADCP & Tide Data Tides & Currents from Roger’s Large Model ADCIRC Forcing
Numerical Model: 1. CALIBRATION Effort 2. Process Studies Initial Conditions Forcing Conditions ROMS Model Conservation Equations Mixing coefficients for salt, temp., momentum Output
Model Calibration: J. Rogers URI, MS Thesis, 2008 Tidal Elevations Match Well Instantaneous Velocity Fields Match Well Data=Red/Blue Model=Pink/Cyan
Model Calibration (Temperature): J. Rogers URI, MS Thesis, 2008
Calibrated Model Applied to Bay Processes: Retention - Mixing/Transport - Resupply J. Rogers URI, MS Thesis, 2008
How is deep return flow partitioned? Flow in East Passage Flow out West Passage Good or Bad? ? Good
Wind Model Reveals How Gyre Flux Varies with Wind & Runoff
How is deep return flow partitioned? Flow in East Passage Flow out West Passage Good or Bad? ? Good
Model Reveals How Gyre Flux Varies with Wind & Runoff
Retention in Greenwich Bay Are flushing rates a function of wind (speed & direction)? Movie 1: NO WIND: Neutral density floats within GB Movie 2: NNE - ward wind
No wind NNE wind Retention in GB (after 10 days)
No wind NNE wind Retention in GB (after 10 days)
12 Days 20 Days Double gyre retention pattern GB Normal flushing pattern WP Wind (8 knots) A) B) C) Figure 1. Frames from a ROMS model run for summer stratification, intermediate tidal amplitude and runoff and a prevailing (steady) 8 kt applied northeastward wind stress. Tracer floats are used to track water parcels and provide an estimate of advective flushing time for the Greenwich Bay (GB) system. A. Nearly initial tracer locations at day 180. B. After 12 days of simulation, only a small fraction of tracers have left. Prevailing winds set up a double gyre system (shown schematically with arrows) which limits exchange with the West Passage (WP). C. After 20 days only 40% of tracers have flushed from GB, as opposed to ~90% flushing after ~3 days for cases without this wind forcing (shown with arrows in A). The natural progression in the data-modeling cycle is a time series deployment to test this model prediction of multi-gyre residual flow patterns during specific wind conditions (locations shown in C).
Flushing of GB Strongly Dependent on Prevailing Winds Wind Speed m/s (to northeast)
Goals • Process-oriented: • Simulate dynamics of flushing, mixing and shelf-water intrusions • Application-oriented: • Provide exchange coefficients for ecological box model
Blackstone River Moshassuck River Ten Mile River Woonasquatucket River Bucklin Pt. WWTF Field’s Point WWTF East Providence WWTF Pawtuxet River Providence River ROMS • High resolution • Fast computation time • Boundary close to area of interest • Initial tests of methodology
Blackstone River Moshassuck River Ten Mile River Woonasquatucket River Bucklin Pt. WWTF Field’s Point WWTF East Providence WWTF Pawtuxet River Prov. River ROMS grid
Conditions for Prov. River model runs Average DYE concentration (mg/L): Blackstone - 1.98 Ten Mile - 2.02 Moshassuck - 1.93 Woonasquatucket - 1.82 Pawtuxet - 2.63 Field's Point - 8 Bucklin Point - 8 E. Providence 8 Winds (mph): Low NE - 0.5 Average NE - 8.4 High NE - 25.4 Low SW - 0.4 Average SW - 7.1 High SW - 18.5 Average River flow (m3/s): Blackstone - 22.1 Ten Mile - 3.1 Moshassuck - 1.1 Woonasquatucket - 2.1 Pawtuxet - 10 Average effluent flow (m3/s): Field's Pt. - 2.17 Bucklin Pt. - 1.09 E. Providence - 0.24
Blackstone, Ten Mile, Woonasquatucket, and Moshassuck Rivers Bucklin WWTF Field’s Point WWTF East Providence WWTF Pawtuxet River Open boundary
ROMS Projects: Providence River Flushing: Nicole La Sota -Dye boxes for CHRP modeling -Nutrient releases from treatment facilities NBC / Sea Grant: Mid-Bay Physics: Justin Rogers -Transport through mid-Bay -Exchange with sub-regions (Prov. River, Greenwich Bay, Mt. Hope Bay) -Flushing of sub-regions vs. forcing trends -Re-supply of deep water vs. forcing Sea Grant / NOAA CHRP/ NBC Bay-Rhode Island Sound Exchange: Anna Pfeiffer-Herbert -Exchange vs. forcing -Seasonal variations -LARVAL dispersion NOAA CHRP/ IGERT
Intermediate Scale Grid: Goals: 1. Coverage from Seekonk River to mouth of Narragansett Bay Fine resolution in key areas of interest: Providence River, Mt. Hope Bay, Ohio Ledge, Greenwich Bay 3. Total grid cells which still allow for reasonable run times for model simulations. (~10-30 days of simulation per computer day).
ROMS history • Providence River • Developed by D. Bergondo • N. La Sota’s thesis • 2. NB-RIS • J. Roger’s thesis • 3. Narragansett Bay • D. Ullman, C. Kincaid
Concluding Remarks Extent of counter Goal: Understand Bay processes all positions & all time Combination of good spatial/temporal data & modeling is a step in this direction NBC Upper Bay Processes Multiple projects: System response vs. Physical Forcing Mt. Hope Bay circulation/exchange /mixing study. ADCP, tide gauges (Deleo, 2001) NOAA: Mid-Bay Processes (-09) Interdisciplinary Projects: Coupling physics, Chemistry, biology Bay-RIS exchange study (98-02)
In 3D, moving boundary increase cells by factor ~200 or 100000 new cells!!! SLOWS Calculation