Download
1 / 10
100 likes | 102 Views
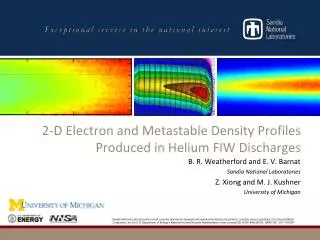
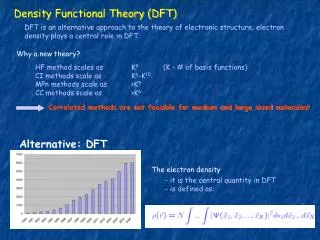
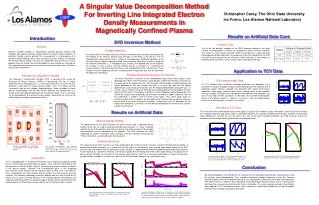
This study compares different plasma heating configurations and their impacts on electron temperature and density profiles. It also explores the experimental and neoclassical particle fluxes for these configurations.

E N D
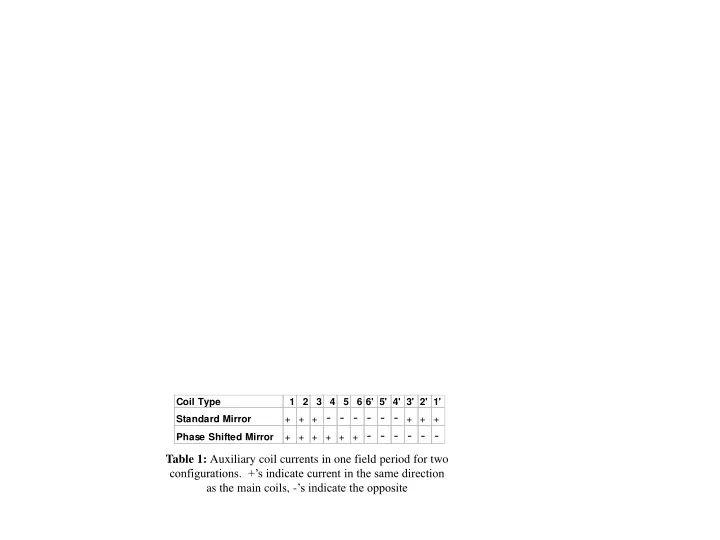
Table 1: Auxiliary coil currents in one field period for two configurations. +’s indicate current in the same direction as the main coils, -’s indicate the opposite
a) b) Figure 1: Electron a) temperature and b) density profiles for a Standard Mirror plasma with central heating
a) b) Figure 2: Electron a) temperature and b) density profiles for a Standard Mirror plasma with off-axis heating
Figure 3: Experimental and neoclassical particle fluxes for a Standard Mirror plasma with central heating
a) b) Figure 4: Electron a) temperature and b) density profiles for a QHS plasma with central heating
Figure 5: Experimental and neoclassical particle fluxes for a QHS plasma with central heating
1 2 3 4 5 6 7 8 9 10 Figure 6: Time-resolved energy density at each Thomson scattering spatial location
Figure 7: Measured absorbed power density profile for a QHS plasma with central heating
a) b) Figure 8: Profiles of a) electron temperature and absorbed power and b) experimental and neoclassical electron thermal diffusivity for a Phase Shifted Mirror plasma
a) b) Figure 9: Profiles of a) electron temperature and absorbed power and b) experimental and neoclassical electron thermal diffusivities (solid lines are experimental values) for QHS and Phase Shifted Mirror plasmas