Download
1 / 37
370 likes | 508 Views
UnB Programa de Pós-Graduação em Administração Programa Multiinstitucional e Interregional de Pós-Graduação em Ciências Contábeis UnB-UFPB-UFRN Financial Econometrics I. The Matrix. Otavio R. de Medeiros. Matrices. A Matrix is a collection or array of numbers

E N D
UnB Programa de Pós-Graduação em Administração Programa Multiinstitucional e Interregional de Pós-Graduação em Ciências Contábeis UnB-UFPB-UFRN Financial Econometrics I The Matrix Otavio R. de Medeiros UnB - Financial Econometrics I Otavio Medeiros
Matrices • A Matrix is a collection or array of numbers • Size of a matrix is given by number of rows and columns R x C • If a matrix has only one row, it is a row vector • If a matrix has only one column, it is a column vector • If R = C the matrix is a square matrix UnB - Financial Econometrics I Otavio Medeiros
Definitions • Matrix is a rectangular array of real numbers with R rows and C columns. are matrix elements. UnB - Financial Econometrics I Otavio Medeiros
Definitions • Dimension of a matrix: R x C. • Matrix 1 x 1 is a scalar. • Matrix R x 1 is a column vector. • Matrix 1 x C is a row vector. • If R = C, the matrix is square. • Sum of elements of leading diagonal = trace. • Diagonal matrix : square matrix with all elements off the leading diagonal equal to zero. • Identity matrix: diagonal matrix with all elements in the leading diagonal equal to one. • Zero matrix: all elements are zero. UnB - Financial Econometrics I Otavio Medeiros
Definitions • Rank of a matrix: is given by the maximum number of linearly independent rows or columns contained in the matrix, e.g.: UnB - Financial Econometrics I Otavio Medeiros
Matrix Operations • Equality: A = B if and only if A and B have the same size and aij = bij " i, j. • Addition of matrices: A+B= C if and only if A and B have the same size and aij + bij = cij " i, j. UnB - Financial Econometrics I Otavio Medeiros
Matrix operations • Multiplication of a scalar by a matrix: k.A = k.[aij], i.e. every element of the matrix is multiplied by the scalar. UnB - Financial Econometrics I Otavio Medeiros
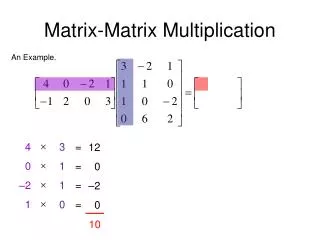
Matrix operations • Multiplication of matrices: if A is m x n and B is n xp, then the product of the 2 matrices is A.B = C, where C is a m x p matrix with elements: • Example: Note: A.B ¹ B.A UnB - Financial Econometrics I Otavio Medeiros
Transpose of a matrix • matrix transpose: if A is m x n, then the transpose of A is n x m, i.e.: UnB - Financial Econometrics I Otavio Medeiros
Properties of transpose matrices • (A+B)+C=A+(B+C) • (A.B).C=A(B.C) UnB - Financial Econometrics I Otavio Medeiros
PROJEÇÕES • Propriedades: UnB - Financial Econometrics I Otavio Medeiros
Square matrices : • Identity matrix I: Note: A.I = I.A = A, where A has the same size as I. UnB - Financial Econometrics I Otavio Medeiros
Square matrices : • Diagonal matrix: UnB - Financial Econometrics I Otavio Medeiros
Square matrices: • Scalar matrix = diagonal matrix, when l1 = l2 = ... =ln . • Zero matrix: A + 0 = A; A x0 = 0. UnB - Financial Econometrics I Otavio Medeiros
Trace of a matrix: If A is m x n and B is n x m, then AB and BA are square matrices and tr(AB) = tr (BA) UnB - Financial Econometrics I Otavio Medeiros
Determinants • matrix 2 x 2: UnB - Financial Econometrics I Otavio Medeiros
Determinants • matrix 3 x 3: UnB - Financial Econometrics I Otavio Medeiros
Determinants • Matrix 3 x 3: UnB - Financial Econometrics I Otavio Medeiros
Inverse matrix • The inverse of a square matrix A, named A-1, is the matrix which pre or post multiplied by A gives the identity matrix. • B = A-1 if and only if BA = AB = I • Matrix A has an inverse if and only if det A ¹ 0 (i.e. A is non singular). • (A.B)-1 = B-1.A-1 • (A-1)’=(A’)-1\ if A é symmetrical and non singular, then A-1 is symmetrical. • If det A ¹ 0 and A is a square matrix of size n, then A has rank n. UnB - Financial Econometrics I Otavio Medeiros
Steps for finding an inverse matrix • Calculation of the determinant: Kramer’s rule or cofactor matrix. • Minor of the element aij is the determinant of the submatrix obtained after exclusion of the i-th row and j-th column. • Cofactor is the minor multiplied by (-1)i+j, UnB - Financial Econometrics I Otavio Medeiros
Steps for finding an inverse matrix • Laplace expansion: take any row or column and get the determinant by multiplying the products of each element of row or columns by its respective cofactor. • Cofactor matrix: matrix where each element is substituted by its cofactor. UnB - Financial Econometrics I Otavio Medeiros
Example 2 x 2 matrix : UnB - Financial Econometrics I Otavio Medeiros
Example • 3 x 3 matrix : UnB - Financial Econometrics I Otavio Medeiros
Matrix differentiation: UnB - Financial Econometrics I Otavio Medeiros
Matrix differentiation: UnB - Financial Econometrics I Otavio Medeiros
Matrix differentiation: UnB - Financial Econometrics I Otavio Medeiros
Linear regression, example 1: Perform a linear regression, given that the data for the dependent variable are 1, 2, 1, 2, 2 and for the independent variable are 1, 2, 2, 3, 3. Solution: Since a = 0.5 e b = 0.5, the regression equation is yt = 0.5 + 0.5xt UnB - Financial Econometrics I Otavio Medeiros
Linear regression, example 2: a firm manufacturing bikes is preparing a project and wishes to find out what is the relationship between bike sales and national income (GDP). In the last 5 years, bike sales increased by 5%, 9%, 5%, 6% and 10%, whereas GDP increased by 2,5%, 4%, 3%, 2,5%, 4%. What is the relationship between bike sales and GDP? UnB - Financial Econometrics I Otavio Medeiros
Example 2: Solution 1 The past relationship between bike sales growth and GDP growth is given by: yt = -0.0204 + 2.826xt UnB - Financial Econometrics I Otavio Medeiros
Example 2: Solution 2 Hint: to avoid working with decimals, we can multiply y and x by 100. To find the correct final result, divide a by 100. b doesn’t change. UnB - Financial Econometrics I Otavio Medeiros
Graph (Excel): UnB - Financial Econometrics I Otavio Medeiros
Goodness of fit: • A measure of the goodness of fit of a regression is the coefficient of determination R2, which is defined as: UnB - Financial Econometrics I Otavio Medeiros
Goodness of fit: • When all the residuals are equal to nil, R2 = 1, meaning that the regression is perfect, with all data points located on the line. • When then R2 = 0, meaning that there is no regression. • Hence, the range for R2 will be: 0 < R2< 1 • Values of R2 close to 1 indicate a good regression, while low values of R2 indicate a bad or inexisting regression. UnB - Financial Econometrics I Otavio Medeiros
Calculation of R2 – Example 1: UnB - Financial Econometrics I Otavio Medeiros
Calculation of R2 – Example 2: UnB - Financial Econometrics I Otavio Medeiros