Download
1 / 29
290 likes | 410 Views
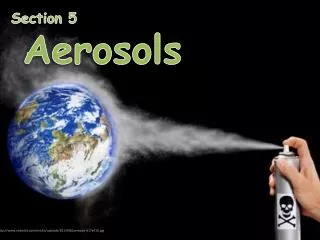
Chemical Data Assimilation: Aerosols - Data Sources, availability and needs. Raymond Hoff Physics Department/JCET UMBC. Assimiliation – real time or retrospective?. Very little aerosol number distribution or mass data is available in a real-time sense

E N D
Chemical Data Assimilation:Aerosols- Data Sources, availability and needs Raymond Hoff Physics Department/JCET UMBC
Assimiliation – real time or retrospective? • Very little aerosol number distribution or mass data is available in a real-time sense • Much of the data which exists is at P=1000 mb • Remote sensing data (vertical dimension) uses optical extrinsic variables (extinction, scattering, absorption coefficients, AOD, albedo) • Some retrievals of aerosol size and indices of refraction are available (e.g. AERONET, MISR) • Assimiliation of these data involves another model
"Traditional" Data Sources:Surface data - retrospective Courtesy Jim Szykman, EPA
Surface Data - Real TimeAIRNoW CAMMS TEOM Nephelometer Beta Attenuation Courtesy Jim Szykman, EPA
Surface Sites - speciation Courtesy Jim Szykman, EPA
Current Sources of Aerosol Data Source: Hoff et al. (2005)
Column measurements - MODIS July 9, 2000 Courtesy: J. Engel-Cox
A good IDEA Courtesy: CIMSS, UW
Linking optical properties and mass concentration Engel-Cox et al. 2004
Old Town TEOM MODIS AOD Baltimore, MD Summer 2004 July 21 Mixed down smoke July 9 High altitude smoke PM2.5 (g/m3) MODIS Aerosol Optical Depth Courtesy EPA/UWisconsin
The Regional East Atmospheric Lidar Mesonet (REALM) A subsidiary of FARLINET
U.S. Air Quality (The Smog Blog), http://alg.umbc.edu/usaq Daily posts NASA satellite images, EPA data, etc. Index & Links Over 1,000,000 hits over 19 months ~ 10,000 visits per month ~800 unique visitors per week including EPA, NASA, NOAA, & States
Data for: September 1, 2004 Click on a REALM Participant for their LIDAR data. http://alg.umbc.edu/REALM
REALM: Wisconsin lidar for July 2004 Eloranta, U. Wisc
July 17 July 18 July 19 MODIS
19 July 2004 21 July 2004
Mission Concept CALIPSO
GOCART Aerosol Species Prognostic variables in aerosol phase sulfate, black carbon (hydrophobic and hydrophilic), organic carbon (hydrophobic and hydrophilic) , dust (five size bins), sea salt (four size bins), ammonium, nitrate Prognostic variables in gaseous phase hydrogen peroxide, ozone, sulfur dioxide, DMS, MSA, ammonia, nitric acid, hydroxyl radical Prognostic variables in aqueous phase sulfide, sulfate, hydrogen peroxide, ammonium, nitrate
PM2.5 surface (TEOMS) Real-time speciation AOD PBL height PM2.5 - lidar backscatter correlations PM profiles PM speciation fractions Assimilate in the near future?
Further discussion topics • Vertical dimension • Mass conservation • Divergence/convergence/loss • Speciation vs height
Alaskan Smoke over Maryland9 July 2004 10 July 2004, am
8/17/04 8/15/04 8/16/04 0 0.1 0.2 0.3 0.4 0.5 0.6 0.7 A comparison of aerosol optical depth simulated using CMAQ with satellite estimates, B. Roy et al. 2005
Modeled and Observed Variations in Daily Average Surface PM2.5 7/19/04 7/20/04 7/18/04 7/23/04 7/21/04 7/22/04 μg/m3 5 10 15 20 25 30 35 Numerical skillAssessment of Eta-CMAQ Forecasts of Particulate Matter - Mathur et al. (2005) AMS Meeting
July 16-22, 2004: Evidence of Effects of Long Range Transport Originating Outside the Modeled Domain Evolution of Model and Observed Aerosol Optical Depth MODIS 7/16 7/17 7/18 7/19 7/20 7/22 Model 0 0.1 0.2 0.3 0.4 0.5 0.6 0.7 • Transport from outside the domain influences observed PM concentrations which • are grossly under-predicted during this period • Model picks up spatial signatures ahead of the front • Under predictions behind the front (due to LBCs)
Wash. D.C. Bermuda Regional Scale Haze