Download

1 / 34
340 likes | 423 Views
Other Network Models. Deterministic weight updates. Until now, weight updates have been deterministic. State = current weight values & unit activations But a probabilistic distribution can be used to determine whether or not a unit should change to the new calculated state.

E N D
Deterministic weight updates • Until now, weight updates have been deterministic. • State = current weight values & unit activations • But a probabilistic distribution can be used to determine whether or not a unit should change to the new calculated state. • So for example, in Discrete Hopfield, even if a unit is selected for update, it might not be updated.
Simulated Annealing Points tried at medium Points tried at low Find a global minimum using simulated annealing
S.A. • A deterministic algorithm like backpropogation that uses gradient descent often gets caught in local minima. • Once caught, the network can no longer move along error surface to a more optimal solution. • Metropolis algorithm: Select at random a part of the system to change. The change is always accepted if the global system energy falls, but if there’s an increase in energy then the change is accepted with propability p.
S.A. Is change in energy and T is temperature.
Example algorithm for function minimizing (Geman and Hawang, 1986) • Select at random an initial vector x and an initial value of T. • Create a copy of x called xnew and randomly select a component of xnew to change. Flip the bit of the selected component. • Calculate the change in energy. • If the change in energy is less than 0 then x = xnew. Else select a random number between 0 and 1 using a uniform distribution probability density function. If the random number is less than formula then x = xnew.
Continued 5. If there have been a specified number (M) of changes in x for which the value of f has dropped or there have been N changes in x since the last change in temperature, then set T = αT. 6. If the minimum value of f has not decreased more than some specified constant in the last L iterations then stop, otherwise go back and repeat from step 2.
Boltzmann machine • Is a neural network that uses the idea of simulated annealing for updating the network’s state. • It’s a Hopfield network that uses a stochastic process for updating the state of a network unit. • Assume +1 and -1 activation values.
Weight update = correlation between units during clamped phase = correlation between units during free-running phase
An example Boltzmann machine (can be used for autoasssociation) Output layer Input layer
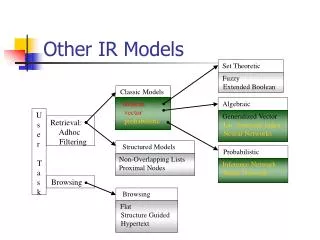
Probabilistic Neural Networks • In a PNN, a pattern is classified based on its proximity to neighbouring patterns. • The manner in which neighbouring patterns are distributed is important. • A simple metric to decide the class of a new metric is to calculate the centroid for each class. • The PNN is based on Bayes’ technique of classification, make a decision as to the most likely class that a sample is taken from. The decision requires to estimate a probability density function for each class. • The estimate is constructed from training data.
Gaussian dist. Gaussian function for two variables
PDF (Probability density function) The estimated PDF is the summation of the individual Gaussians centered at each sample point. Here σ = 0.1
PDF The same estimate as in previous figure but with σ = 0.3. The width is too large, then there is a danger that classes will become blurred (a high chance of misclassifying).
PDF The same estimate as in previous figure but with σ = 0.05. The width becomes too small, then there is a danger of poor generalization: the fit around the training samples becomes too close.
PPN • The class with a highly dense population in the region of an unknown sample will be preferred over other classes. • The probability density function (PDF) needs to be estimated. • The estimate can be found using Parzen’s PDF estimator which uses a weight function that is centered at a training point. The weight function is called a potential function or kernel. • A commonly used function is a Gaussian function.
PPN • The Gaussian functions are then summed to give the PDF. • The form of Gaussian function is as follows: This square will be cancelled with square-root in normalization formula.
Example • There are two classes of a data of a single variable in the following figure. A sample positioned at 0.2 is from an unknown class. Using a PDF with a Gaussian kernel, estimate the class that the sample is from.
Unknown sample Figure. The unknown sample to be classified using a PDF.
SOLUTION • The value for α = 0.1. The result of the density estimation are shown in table of the following slide. • Although the unknown sample is closest to a point in class A the calculation favors class B. The reason why B is preferred is the high density of points around 0.35.
The calculation of the density estimation Sample point
The neural network architecture for a PNN • The input and pattern layers are fully connected. • The weights feeding into a pattern unit are set to the elements of the corresponding pattern vector. • The activation of a pattern unit is x is an unknown input pattern.
PNN If the input vectors are all of unit length, then the following form of the activation function can be used. Number of input units = number of features Number of pattern units = number of training samples Number of summation units = number of classes The weights from the pattern to summations units are fixed at 1.
An Example PNN Architecture Output layer Summation layer Input layer Pattern layer
Example • Following figure shows a set of training points from three classes and an unknown sample. Normalize the inputs to unit length and, using a PNN, find the class to which the unknown sample is assigned.
The unknown sample to be classified using a PNN Unknown sample A B C
Solution The vectors shown in previous figure are normalized here.
Calculations of activations >> exp(((0.6247*0.7967)+(0.7809*0.6044)-1)/0.01) ans = 0.0482 >> exp(((0.9138*0.7967)+(0.4061*0.6044)-1)/0.01) ans = 0.0704