Download
1 / 29
290 likes | 413 Views
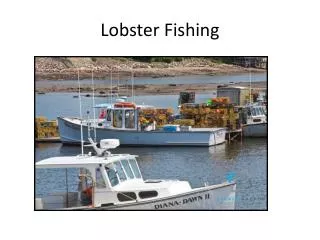
Estimates of entanglement risk for lobster fishing off the coast of Maine. Chris Brehme , Keene State College Hauke Kite-Powell, Woods Hole Oceanographic Institution Scott Kraus, Kerry Lagueux , and Brooke Wikgren , New England Aquarium

E N D
Estimates of entanglement risk for lobster fishing off the coast of Maine Chris Brehme, Keene State College Hauke Kite-Powell, Woods Hole Oceanographic Institution Scott Kraus, Kerry Lagueux, and Brooke Wikgren, New England Aquarium Patrice McCarron and Heather Tetreault, Maine Lobstermen’s Association 2013 Northeast Regional Sea Grant Meeting New Bedford, 19 November 2013
Approach: • Estimate the expected number of whale/fishing gear encounters per year – this will depend on: • fishing effort • vertical line density • trap string configuration • whale activity • density • behavior (transiting, feeding, etc.) • topography • water depth • bottom characteristics • Consider adjustments to fishing effort (time, location, gear configuration) to reduce risk.
Vertical Line Risk Probability of whale-line encounter = f ( lines/km2 whale track/km2 [whale size] )
Ground Line Risk Probability of whale-line encounter = f ( h line length/km2 whale track/km2 [whale size] water depth whale diving )
Fishing Activity Data 5.9 million VL-months Exempt state: 70.6% Non-ex. state: 22.7% 3-6 miles: 3.2% 6-12 miles: 1.4% 12-40 miles: 2.1%
Modeled Whale Activity Interpolation approach based on: E. Bellier and Monestiez P., 2008. Model based block kriging to estimate spatial abundance of wildlife populations from count data. In Proceedings of the Eighth International Geostatistics Congress. Julian Ortiz & Xavier Emery (Eds.). GECAMIN. pp 119-128. ISBN:978-956-8504-18-2.
Whale Activity by Zone 511,500 km whale track “FTWEs”: Dec, Jan: 52.5 Feb, Mar: 3.6 Apr, May: 5.7 Jun, Jul: 9.0 Aug, Sep: 16.2 Oct, Nov: 28.6
Whale Activity Inshore Whale track distribution: State exempt: 0.3% State non-ex.: 0.8% 3-6 miles: 1.7% 6-12 miles: 5.7% 12-40 miles: 91.5%
Baseline: Expected Encounters 2011 expected encounters/year: VL 2,163 GL 342 total 2,505
Sensitivity Analysis • Both fishing effort and whale activity data sets incorporate assumptions • Fishing effort: total number of active traps, and allocation of traps to areas designated by fishermen as rarely/sometimes/always fished • Whale activity: whale activity level in nearshore waters where there is little systematic survey work • Question: do risk hot spots predicted by the model depend on these assumptions?
Sensitivity Scenarios: Fishing Effort • Five vertical line models: • 5/35/60 allocation of traps to rarely/sometimes/often fished areas (base case) • 0.5/9.5/90 shifts more traps to “often fished” • 25/35/40 shifts traps to “rarely/sometimes fished” • 5/ +1 confis 5/35/60 with more traps active • 5/ -1 conf is 5/35/60 with fewer traps active • Moderate uncertainty; +/- 35% (median)
Sensitivity Scenarios: Whale Activity • Three whale activity models: • Predicted WA: assumes some degree of whale activity (0.5 x standard error) in all polygons with at least one sighting (base case) • Low WA: Predicted WA minus 2 x standard error (truncated at zero); represents lower than predicted nearshore whale activity • High WA: Predicted WA plus 2 x standard error; represents higher than predicted nearshore whale activity • High uncertainty, esp. inshore; +/- 90% (median)
Sensitivity Analysis: Base case hot spots • Base case risk hot spots (63%): • A-3 (Aug, Sep) – 32% • A-40 (Jun – Nov) – 8% • C-40 (Oct – Jan) – 9% • D-3 (Jun – Sep) – 5% • F-40 (Nov – Jan) – 4% • G-40 (Dec, Jan) – 5% • Share of risk in these hot spots is insensitive to fishing effort assumptions and Predicted/Low WA • But decreases to 30% with High WA
Sensitivity Analysis continued Base case has 50-60% of risk in state waters (more than half of this in A3 Aug, Sep), and 30% in 12-40 nm. With half of base case near shore whale activity, state waters risk drops to less than 20%, and 12-40 nm risk rises to 60%. (Plausible.) With 10% of whale activity in state waters, state waters risk rises to 90%. (Conceivable but not likely.)
Model Application Examples(Note: Area 1 Maine only) • Effect of Sinking Ground Line (rule in place) • NMFS NE Proposal (2011) • Offshore Trawl-up (12-40nm)
Sinking Ground Line (rule in place) 347 avoided encounters/year; 12% reduction in total pre-rule encounter risk Risk would rise 14% if all zones went back to floating ground line, mainly from: A non-exempt (Aug, Sep) A40 (Aug, Sep) C non-exempt (Jun, Jul) C40 (Dec, Jan) D40 (Dec, Jan) E40 (Nov – Jan) F40 (Nov – Jan) G non-exempt (Oct, Nov) G40 (Nov-Jan)
Results: NMFS NE Proposal (2011) expected encounters/year: VL 1,987 (-167) GL 342 total 2,329 7% reduction from baseline ~80% of this from: C40 (Dec, Jan) D non-ex (Jun – Sep) F40 (Nov – Jan) G40 (Dec, Jan)
Offshore Trawl-ups Risk reduction: from 12% (min 20) to 25% (min 30) VL-month reduction: from 46,000 (min 20) to 72,000 (min 30) DMR2012: 70,000 NMFS NE: 456,000 (8%) Most significant months for 12-40 trawl up risk reduction: Zone A: Aug, Sep, Oct, Nov Zone B: Oct, Nov Zone C: Oct, Nov, Dec, Jan Zone D: Dec, Jan Zone E: Dec, Jan Zone F: Nov, Dec, Jan Zone G: Dec, Jan
Summary • Highest resolution fishing effort & more complete representation of Right Whale activity to date • Model is operational (spreadsheet implementation), can easily reflect alternate management measures and assumptions about fishing & whale activity • Spatial distribution of risk is sensitive to assumptions about inshore whale activity • Assuming inshore activity = 0 is a sure way to NOT address significant percentage of total risk • Risk is concentrated in temporal/spatial hot spots • Danger: blanket measures that miss hot spots are unlikely to reduce risk significantly (though they may reduce VLs) • Opportunity: targeted management measures can reduce risk with minimal disruption of fishing (but may be harder to enforce)
Acknowledgements Collaborators: Chris Brehme, Keene State College Tara Hetz, WHOI Summer Student Fellow Scott Kraus, New England Aquarium Kerry Lagueux, New England Aquarium CrisLutazzi, WHOI Summer Student Fellow Patrice McCarron, Maine Lobstermen’s Association Heather Tetreault, Maine Lobstermen’s Association Sophia Weinman, WHOI Guest Student Brooke Wikgren, New England Aquarium Funding provided by the WHOI and Maine Sea Grant Programs and: