Download
1 / 19
190 likes | 378 Views
Efficient User Interest Estimation in Fisheye Views. Jeffrey Heer and Stuart K. Card 1 Palo Alto Research Center, Inc. 2 University of California, Berkeley. 1,2. 1. Roadmap. Motivation + Background Implementation Evaluation Conclusion. Fisheye Views. Degree of Interest (DOI).

E N D
Efficient User Interest Estimation in Fisheye Views Jeffrey Heer and Stuart K. Card 1 Palo Alto Research Center, Inc. 2 University of California, Berkeley 1,2 1
Roadmap • Motivation + Background • Implementation • Evaluation • Conclusion CHI 2003 – Visualization & Navigation
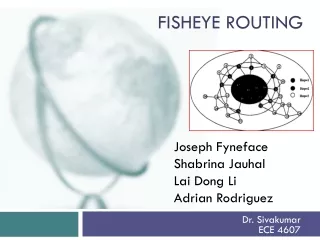
Fisheye Views CHI 2003 – Visualization & Navigation
Degree of Interest (DOI) • Models user’s spontaneous interest across the tree • This model can then be used to inform presentation 0 0 -1 0 -1 0 0 -1 -2 0 -1 -2 0 0 -1 -3 -3 -3 -3 -1 -2 -2 Computed Degree of Interest Cull low Degree of Interest CHI 2003 – Visualization & Navigation
User Modeling in Fisheye Views Degree of Interest Intrinsic Importance + Distance from Point of Interest 0 3 1 1 4 2 2 2 2 2 5 5 1 3 3 0 3 3 3 3 3 3 3 6 6 6 6 2 4 4 Intrinsic Importance Distance from Point of Interest CHI 2003 – Visualization & Navigation
DEMO CHI 2003 – Visualization & Navigation
… the need for speed • Visualization should respond fluidly to user actions • But for each interaction, may have to • Recompute DOI • Recompute Layout • Hard time limit: 100ms (Card, Moran, Newell) • Goal: • Limit all computations to the number of displayed nodes. CHI 2003 – Visualization & Navigation
Naïve Interest Computation 0 -1 0 -2 0 -1 -2 0 -3 -3 -3 -3 -1 -2 -2 Requires visiting the entire tree! CHI 2003 – Visualization & Navigation
Least Common Ancestor Pruning Limit computation to the subtree rooted at least common ancestor. 0 0 0 -1 -2 0 -1 -1 0 -2 -3 -2 0 -2 0 -3 -3 -3 -3 -2 -1 -2 -1 However, no savings if new focus is here Furthermore, this method exploits a specific DOI distribution not necessarily generalizable CHI 2003 – Visualization & Navigation
Solution: Disinterest Thresholding • Saturate DOI function at a disinterest threshold • Compute DOI only for visible nodes • Use thresholding to supply defaults for the others 0 0 -1 0 -1 0 0 -1 0 -1 -2 -2 0 0 -1 -2 -2 -2 -2 -1 -2 -2 Cull low Degree of Interest Computed DOI: minDOI = -1 CHI 2003 – Visualization & Navigation
Disinterest Thresholding 0 -1 0 0 -1 -2 -2 0 -2 -2 -2 -2 -1 -2 -2 CHI 2003 – Visualization & Navigation
Node Attribute Registry • Backing array data structure: table of node attributes. • Tag visible nodes with table index. When attributes are needed (e.g. node.getX()), the table is consulted. • If the node is in the table, the attribute is simply returned. • Else, the suitable default is supplied • DOI: minimum DOI, Position: position of first visible ancestor CHI 2003 – Visualization & Navigation
Evaluation Setup: Time walks through algorithmically generated DOITrees with increasing tree depths. Test System: PIII 1GHz, 256MB RAM 16 MB Video RAM DOI Threshold = -2 Naïve and LCA grow linearly with the number of nodes. Disinterest thresholding grows linearly with number of visible nodes, which in this case grows logarithmically with total number of nodes. CHI 2003 – Visualization & Navigation
Limitations • Doesn’t improve cases where there are a large number (10,000+) visible nodes. • Smooth interaction also dependent on the use of efficient layout algorithms. • Only approximates DOI distribution, which may be problematic if applications wish to use DOI for more than visualization. CHI 2003 – Visualization & Navigation
0 0 -1 0 -1 -2 -2 Thanks!! Questions? Jeffrey Heer jheer@parc.com Stuart K. Card card@parc.com CHI 2003 – Visualization & Navigation
Motivation • The real design problem is not increased access to information, but greater efficiency in finding useful information. • Increasing the rate at which people can find and use relevant information improves human intelligence. CHI 2003 – Visualization & Navigation
Information Visualization • Leverage highly-developed human visual system to achieve rapid understanding of abstract information. 1.2 b/s (Reading) 2.3 b/s (Pictures) CHI 2003 – Visualization & Navigation
Node Attribute Registry • DOI function only sets DOI for nodes above the disinterest threshold. • Nodes are transparently added to registry when DOI is set. • If node is already there, then dirty bit is set. • Registry is resized as necessary. • After DOI computation, non-dirty nodes are removed from registry, dirty bits are cleared. • Result: DOI computation time proportional to the number of nodes displayed! CHI 2003 – Visualization & Navigation
Possible Questions • What about other DOI distributions? • examples? CHI 2003 – Visualization & Navigation