Download
1 / 24
240 likes | 393 Views
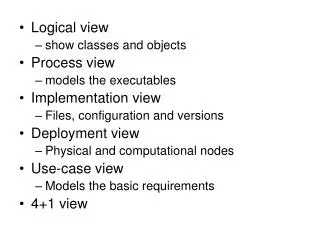
Process View of the Organization . Chapter 2. Learning Objectives. Terminology: Inventory, Thruput, Flowtime Little’s Law Reasons for holding inventory Types of processes. Presbyterian Hospital. Interventional radiology flowchart:. Pass Inspection. Patients with appendix problem.

E N D
Process View of the Organization Chapter 2
Learning Objectives • Terminology: Inventory, Thruput, Flowtime • Little’s Law • Reasons for holding inventory • Types of processes
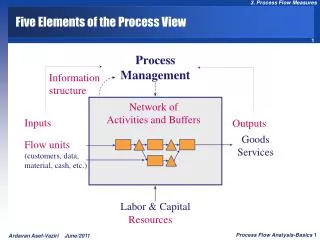
Presbyterian Hospital • Interventional radiology flowchart: Pass Inspection Patients with appendix problem Registration Preparation Procedure Treated Patients Rework Activities Inventory Fail Inspection Flow unit = 1 person • After reading the associated section, you should have a sense of a Gantt chart, which is a depiction of activities (jobs) over time. • Patients wait even when all the activity durations are predictable, why?
In Describing the ProcessesInventory - Flowtime - Thruput • Inventory: Number (amount) of units within (before and after) the process • Number of patients in the interventional radiology waiting room. • Number of students in the OPRE 6302 classroom. • Number of plasma TVs at a circuit city store. • Tons of crude oil stored at Houston refineries. • In Revenue Management Context: Number of seats on a Southwest flight. • Flowtime: Amount of calendar time consumed to complete a process, includes waiting and idle time. • 12 months is the minimum flowtime for the SCM concentration. • 25 minutes is the flowtime for my hair cut. • 4 hours is the flowtime to drive to Houston from Dallas. • Thruput: Number (amount) of units output from a process • 45 cohort students graduate per year from SOM • 5 cars enter the UTD campus from Campbell street every minute • 17 M barrels of oil is refined per year in the U.S.
7:00 8:00 9:00 10:00 11:00 12:00 13:00 14:00 15:00 16:00 17:00 18:00 Inventory - Flowtime on Cumulative Inflow and Outflow graphs Patients at the radiology 11 10 9 8 7 6 5 4 3 2 1 0 Cumulative Inflow Cumulative Outflow Flow Time Patient Arrival Patient Departure Inventory Inventory=Cumulative Inflow – Cumulative Outflow Time
7:00 8:00 9:00 10:00 11:00 12:00 13:00 14:00 15:00 16:00 17:00 18:00 Thruput on Cumulative Inflow and Outflow graphs Patients at the radiology 11 10 9 8 7 6 5 4 3 2 1 0 Slope is the thruput Time Thruput is 11 patients per day of 11 working hours.
Little’s law Long run averages = Expected values I = R x T(Remember from the word “IRriTating” or from the units) I=Inventory; R=Thruput; T=Flowtime 10/minute Spend 1 minute 1 minute is the flow time, T=1 minute 10 per minute is the thruput, R=10/minute 10=10x1 units is the inventory
Little’s powerful law • Powerful formula: Does not depend on • The sequence of the service • First-in-first-out or Last-in-first-out • Distribution of the service times • Uniform or Normal • Formula is for the averages, anyway • Out of the three measures (I,R,T), two can be chosen by management, the other is given by the formula. • When throughput is constant • Reducing inventory = Reducing flow time • Burger King: • Burger Thruput=50kg/day, Inventory=25kg • Burger flowtime= • Customer Thruput=60/hour, Inventory=18 • Customer flowtime=
More interesting observations:Little’s powerful law with Cost of Goods Sold • Dell has a COGS of $20 B per year • The cost of the Dell’s annual sales is $ 20 B • Dell annually spends $20 B, which can be thought as the thruput in terms of dollars. Hence, thruput=$20 B • Dell keeps $391 M worth of inventory, what is the flowtime of Dell products? • 391/20,000 = 0.01955 year = 0.23 months = 7 days • Compaq, COGS=$25.263 B per year, inventory $2 B, so flowtime of Compaq products is • 2/25.263 = 0.079 year = 0.95 months = 28 days • 7 days vs. 28 days is a measurement of Dell’s supply chain efficiency vs. Compaq’s. • What is Dell’s secret in Roundrock, TX?
Even more interesting observations:Inventory turns vs. Gross margin • Inventory turns (turnover) is the reciprocal of the flowtime • Dell turns inventory 52 times a year (once a week) • Compaq turns inventory about 12 times a year (once a month) • Frequent inventory turns indicate that inventory is kept for a short amount of time before it is sent to the customer. • While an item is in the inventory, we incur a percentage of its costs as inventory holding cost to compensate for the capital costs and • Obsoleteness, Perishing, Pilferage, Storage costs. • If the inventory holding cost is 30% per year, what is the holding cost per unit? • 0.3/52 = 0.58%. The 0.58% of the cost of every unit Dell sells is due to inventory holding cost. • What about Compaq? • 0.3/12 = 2.5%.
Much more interesting observations:Inventory turns vs. Gross margin of Retailers • Statement: Companies which turn inventory less frequently has higher gross margin. • Better statement: Companies which turn inventory less frequently sell unpopular, rare, slow moving items. They charge a premium to consumers who want such items. That is why their gross margin is higher. • We must be careful while making generalizations from the graph on the left. • However, these graphs are beneficial for benchmarking purposes. • For example, it is very interesting to know that food stores have an average of 10.78 inventory turns per year while jewelry stores have 1.68 turns per year. Retailer B Retailer B Retailer A Retailer A Radio Shack area Source: Gaur, Fisher, Raman (ManSci 2005)
Top 25 Supply Chains AMR research http://www.amrresearch.compublishes reports on supply chains and other issues. The Top 25 supply chains report comes out in Novembers. The table on the right-hand side is from The Second Annual Supply Chain Top 25 prepared by Kevin Riley and released in November 2005.
Why to hold Inventory? Pipeline inventory: Work in process or in transit In view of Little’s formula, how can we make pipeline inventory=0? • Set thruput=0 or set flowtime=0. • That is, do not process at all or process instantaneously. • Smoothing cumulative inflow and outflow graphs: Cumulative Number of patients 7 6 5 4 3 2 1 1.5 Patients 1.5 hours 7:00 8:00 9:00 10:00 11:00 12:00 Time
Undated Planners Aug- Dec Apr Aug Dec+ Apr+ Why to hold Inventory?Seasonal inventory: Unstable demand or supply • Unstable demand stable supply • Planners starting on Jan 1 and Sep 1 (academic year) • Unstable supply stable demand • Sugar beets inventory at a sugar producer, Monitor Sugar Tons of Beets 1400 Total Beets Received (In 000’s) 1200 1000 Inventory Total Beets Processed 800 600 400 200 0 Time End of Harvest
Why to hold Inventory?Cycle inventory: Economies of scale in processing • Number of eggs in my fridge: Stable demand, stable supply Number of eggs 12 Sun Sun+ Fri+ • Number of trays, which is required for interventional radiology, received once in a week New shipments arrive Inventory 20 18 16 14 12 10 8 6 4 2 Days 0 1 2 3 4 5 6 7 8 9 10 11 12 13 14 15 16 17 18 19 20 21
6 6 5 5 4 4 3 3 2 2 1 1 Why to hold Inventory?Decoupling inventory: To operate more independently Two steps: First step takes 1 min or 3 mins with equal probability. Second step always takes 2 mins. Consider an instance of 6 parts to process, whose first step processing times are 1,1,1,3,3,3. Parts 6 6 5 5 With buffer between steps: 4 W 4 Step 2 is waiting for Step 1 3 W 3 Earlier Completion with buffer 2 W 2 1 1 Time Parts Cannot start Part 3 Without buffer between steps: Time
Why to hold Inventory?Safety inventory: To absorb variability Demand between ordering epochs can be stochastically variable. The inventory should be increased to absorb this variability. Why is not the tray inventory zero just before the receipt of the shipment? What if we reduce the safety inventory by 2 trays? Inventory 20 18 16 14 12 10 8 6 4 2 Days 0 1 2 3 4 5 6 7 8 9 10 11 12 13 14 15 16 17 18 19 20 21 There is no inventory of trays on the 14th day. If the delivery is late or one more patient comes, the next patient cannot be served. Such a shortage can have mortal consequences.
Process Types • Job Shops: Small lots, low volume, general equipment, skilled workers, high-variety. • Ex: tool and die shop, veterinarian’s office • Batch Processing: Moderate volume and variety. Variety among batches but not inside. • Ex:paint production, OPRE 6302 sections • Repetitive/Assembly: Semicontinuous, high volume of standardized items, limited variety. Textbook calls this worker/machine paced line. • Ex: auto plants, cafeteria • Continuous Processing: Very high volume an no variety. • Ex: steel mill, chemical plants • Projects: Nonroutine jobs. • Ex: preparing OPRE 6302 midterm
Questions Before Selecting A Process • How much variety of products and services? • How much flexibility of the process; volume, mix, technology?
Variety, Flexibility, & Volume Job Shop Batch Repetitive assembly Continuous Flow
Product – Process Matrix • Similar processes tend to have similar problems
Few Major Products, Higher Volume High Volume, High Standard- ization Low Volume One of a Kind Multiple Products, Low Volume Flexibility- Quality Job Shop Book Writing Batch Movie Theaters Assembly Line Automobile Assembly Continuous Flow Sugar Refinery Dependability- Cost Flexibility-Quality Dependability-Cost Product - Process Matrix
Low Volume (unique) Medium Volume (high variety) High Volume (lower variety) Very high volume (standardized) Unit variable costs generally too high Job Shop CABG Surgery Batch Process van Heusen Shirts Manzana Insurance Worker-paced line Toshiba Machine-paced line Toyota Utilization of fixed capital generally too low National Cranberry Continuous process Product - Process Matrix • There exists a long-term drift from the upper left to the lower right
Summary • Terminology: Inventory, Thruput, Flowtime • Little’s law • Reasons for holding inventory • Types of processes