Download
1 / 22
220 likes | 331 Views
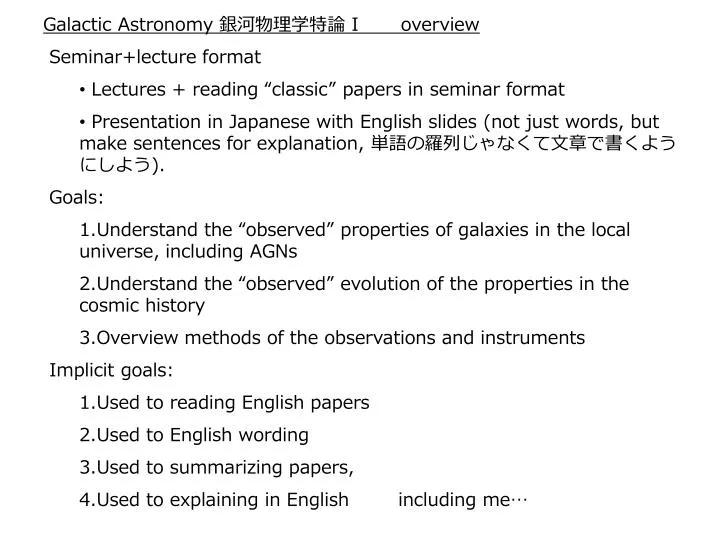
Galactic Astronomy 銀河物理学特論 I overview Seminar+lecture format Lectures + reading “classic” papers in seminar format Presentation in Japanese with English slides (not just words, but make sentences for explanation, 単語の羅列じゃなくて文章で書くようにしよう ). Goals:

E N D
Galactic Astronomy 銀河物理学特論 I overview • Seminar+lecture format • Lectures + reading “classic” papers in seminar format • Presentation in Japanese with English slides (not just words, but make sentences for explanation, 単語の羅列じゃなくて文章で書くようにしよう). • Goals: • Understand the “observed” properties of galaxies in the local universe, including AGNs • Understand the “observed” evolution of the properties in the cosmic history • Overview methods of the observations and instruments • Implicit goals: • Used to reading English papers • Used to English wording • Used to summarizing papers, • Used to explaining in English including me…
Galactic Astronomy 銀河物理学特論 I overview • Contents: • Statistical properties of galaxies in the local universe • Stellar properties of galaxies • Emission line diagnostics of galaxies (藤井(慎)) • Tremonti et al. 2004, ApJ, 613, 898 • Morphological properties of galaxies • Dynamical structure of galaxies (小室) • Dependence of galaxy properties on “environment” (本間) • Multi-wavelength view of galaxies (IR, 藤井(淳)) • Active galaxies and super massive black holes in the local universe • Relation between bulges and super massive black holes of galaxies • Unified model of Active Galactic Nuclei • Observations of galaxies in the distant (high-redshift universe) • Searching for distant galaxies, method • Luminosity function of galaxies and its evolution • Stellar mass function of galaxies (本田) • Chemical evolution of galaxies • Evolution of dynamical properties of galaxies (Akhlaghi) • Co-evolution of galaxies and super massive black holes • Observational astronomy in future
Galactic Astronomy銀河物理学特論 ILecture I: Statistical properties of galaxies in the local universeThanks to the imaging and spectroscopic survey database made by Sloan Digital Sky Survey, statistical properties of galaxies can be discussed with high “precision”. 2011/10/03
Sloan Digital Sky Survey : Imaging and spectroscopic surveys in the optical wavelength conducted with a dedicated (専用) 2.5m telescope @ NewMexico.The imaging survey covers 8,423 sq. degree (in red) in 5 bands, and the spectroscopic survey covers 8.032 sq.degree (in green). The spectroscopic survey obtains optical spectra of galaxies and quasars in the 3800-9200A wavelength range withspectral resolution R=1800-2200. http://www.sdss.org/
Sloan Digital Sky Survey : Imaging survey Imaging data are obtained in u(3551A; 22.0mag), g(4686A; 22.2mag), r(6165A; 22.2mag), i(7481A; 21.3mag), z(8931A: 20.5mag) bands (the numbers in the parenthesis shows the “effective wavelength” and detection limit in magnitude for point sources) with drift-scan mode of the mosaic CCD camera. Typical image size is 1.4” in r-band. “Efficiency” curves of filters used in the imaging survey. They includes atmosphere transparency, CCD quantum efficiency (QE), and telescope throughput. http://www.astro.princeton.edu/PBOOK/camera/camera.htm http://home.fnal.gov/~annis/astrophys/filters/filters.html
Sloan Digital Sky Survey : Imaging survey Sample of galaxy images with r<16mag Fukugita et al. 2007, ApJ, 134, 579
Sloan Digital Sky Survey : Imaging survey Sample of galaxy images with r<16mag Fukugita et al. 2007, ApJ, 134, 579
Sloan Digital Sky Survey : Imaging survey Sample of galaxy images with r<16mag Fukugita et al. 2007, ApJ, 134, 579
Sloan Digital Sky Survey : Imaging survey Sample of galaxy images with r<16mag Fukugita et al. 2007, ApJ, 134, 579
Sloan Digital Sky Survey : Spectroscopic survey Large spectroscopic survey with optical fiber spectrograph cunducted. alaxies, 929,555 galaxies brighter than r(Petrosian)<17.77 and 111,693 z<2.3 quasars and 9,670 (z>2.3) quasars are spectroscopically observed. http://www.astro.princeton.edu/PBOOK/spectro/spectro.htm Optical design of the fiber spectrograph. Throughput of each element (bottom) and total spectrograph efficiency (top).
Seminar 1:Kauffmann et al. 2003, MNRAS, 341, 33 (Paper I)Kauffmann et al. 2003, MNRAS, 341, 54 (Paper II)Goal : 目的Sample, data : サンプル, データMethod : 方法、観測手法、装置Results: 結果Discussion: 結果についての議論 2011/10/03
Goal: • Examine stellar mass of galaxies accurately considering their stellar population. • So far, mass-to-light ratios of galaxies are estimated with their colors. In this paper, the ratios are estimated with absorption line indices. • Then, examine statistical properties of galaxies as a function of their stellar mass.
Sample • Spectroscopic data of 122,808 galaxies from SDSS DR1
Method: Absorption line indices, Dn(4000), HdA index, are used to quantitatively examine spectra of galaxies Hd A index: after removing contamination of Hd emission line using Hb, Hg emission line strength. Effect of different metalicity (2.5solar, solar, 0.2solar) Effect of different stellar spectral model Young Old O,Bstars have weak Hd abs. Late-B early-F stars have strong Hd abs. Dn(4000) index
Method : The actual measured data (left) and constructed models (model) are compared on the Dn(4000), HdA index plane. The solid lines in the left panels are tracks of burst star formation model and the points are “continuus” star formation model. Models caluculated with BC2003 model. Exponentially-decaying continnus star formation model + random “bursty” star formation. Kroupa IMF, 0.25-2 Zsolar。
Method: For each galaxy, using its Dn(4000) Hd-a indices, likelihood of each model is caluculated with Bayesian statistics. 95% of the model Fburst>0.05 >0.1Gyr 95% of the model Fburst>0.05 <0.1Gyr 95% of the model Fburst=0 Examples of estimation Dn(4000) HdA の上で特徴的な領域。
Method: In order to determine the effect of dust reddening, the difference between observed colors and the best fit model are examined. Estimated amount of dust reddening as a function of z-band absolute magnitude and Dn(4000). The colors of model SEDs (blue dots) and observed galaxies (black dots).Left panels shows the colors without emission line correction and right panels with emission line correction
Results: Estimated stellar mass to light ratio of galaxies are summarized. In the right panel, the distributions of 95% reliability range of each galaxy are shown for all, Dn(4000)>1.8 (dot), and Dn(4000)<1.4 (dash) galaxies.
Results 1 The relation between stellar mass of galaxies and their absorption line strength are plotted. There is a strong variation at stellar mass of 3x10^11 Msolar.
Results 2 The stellar mass of galaxies and their absorption line strength are shown in different way.
Results Relation between stellar mass of galaxies and their surface stellar mass density (left) and their concentration (right). More massive galaxies have higher surface stellar mass density and higher concentration.
Discussions: • Galaxies properties changes at stellar mass of 3x10^11 • More massive galaxies have older stellar population, higher stellar mass density, higher concentration.