Download
1 / 10
100 likes | 216 Views
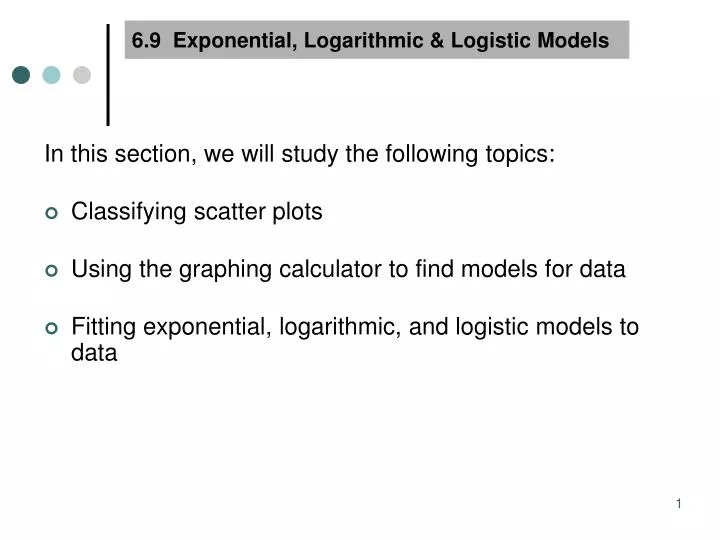
6.9 Exponential, Logarithmic & Logistic Models. In this section, we will study the following topics: Classifying scatter plots Using the graphing calculator to find models for data Fitting exponential, logarithmic, and logistic models to data. Example:

E N D
6.9 Exponential, Logarithmic & Logistic Models In this section, we will study the following topics: Classifying scatter plots Using the graphing calculator to find models for data Fitting exponential, logarithmic, and logistic models to data
Example: Decide whether the scatter plot could best be modeled by a linear, quadratic, exponential, logarithmic, or logistic model. I II III IV V • Classifying Scatter Plots
To find an exponential, logarithmic, or logistic model for a set of data using the TI-83 graphing calculator, follow the same steps you have used for linear and quadratic regression. After you have entered your data into lists and viewed your stat plot, go to CALC and choose one of the following: 9: LnReg for a natural logarithmic model 0: ExpReg for an exponential model B: Logistic for a logistic model • Fitting Exponential, Logarithmic, and Logistic Models to Data
Here’s what you will see: 9: LnReg for a natural logarithmic model 0: ExpReg for an exponential model B: Logistic for a logistic model
Year Number of Stores 1987 17 1989 55 1991 116 1993 272 1995 676 1997 1412 1999 2135 2001 4709 Example • The number of Starbucks stores substantially increased between 1987 and 2001.
Let f(t) represent the number of stores at t years since 1980. • Enter data, graph scatter plot, and determine appropriate model. • Find the regression equation for the data. Round values to three decimal places. • What is the percent rate of growth of stores during this period (1987 – 2001)?
What does the coefficient “a” represent within the context of this problem? • If the number of stores was to continue at the same rate, predict the number of stores in 2008. Do you think that this is a good model for predicting the number of stores in 2008? Explain.
Year Number of Stores 2002 5886 2003 7225 2004 8569 2005 10,241 2006 12,440 More Data Does the trend continue??
More Examples • Pp 492-93 #5, 7, 9