Download
1 / 50
620 likes | 930 Views
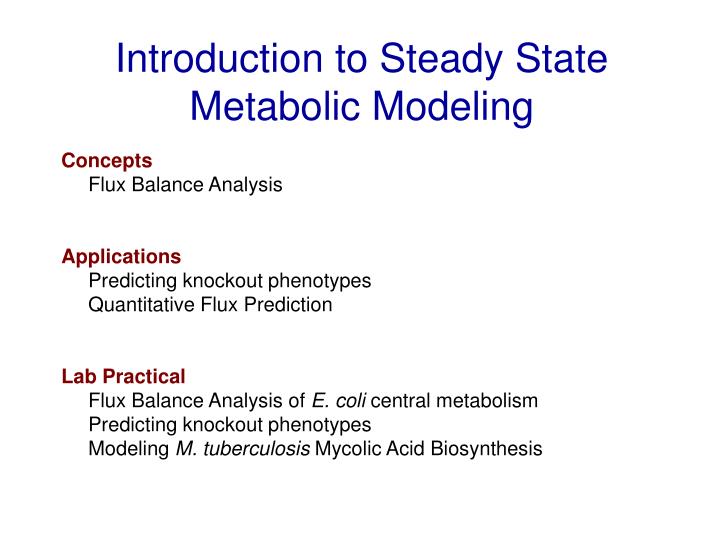
Introduction to Steady State Metabolic Modeling. Concepts Flux Balance Analysis Applications Predicting knockout phenotypes Quantitative Flux Prediction Lab Practical Flux Balance Analysis of E. coli central metabolism Predicting knockout phenotypes

E N D
Introduction to Steady State Metabolic Modeling Concepts Flux Balance Analysis Applications Predicting knockout phenotypes Quantitative Flux Prediction Lab Practical Flux Balance Analysis of E. coli central metabolism Predicting knockout phenotypes Modeling M. tuberculosis Mycolic Acid Biosynthesis
Why Model Metabolism? • Predict the effects of drugs on metabolism • e.g. what genes should be disrupted to prevent mycolic acid synthesis • Many infectious disease processes involve microbial metabolic changes • e.g. switch from sugar to fatty acid metabolism in TB in macrophages
Genome Wide View of Metabolism Streptococcus pneumoniae • Explore capabilities of global network • How do we go from a pretty picture to a model we can manipulate?
Metabolic Pathways hexokinase Metabolites glucose Enzymes phosphofructokinase Reactions & Stoichiometry 1 F6P => 1 FBP Kinetics Regulation gene regulation metabolite regulation phosphoglucoisomerase phosphofructokinase aldolase triosephosphate isomerase G3P dehydrogenase phosphoglycerate kinase phosphoglycerate mutase enolase pyruvate kinase
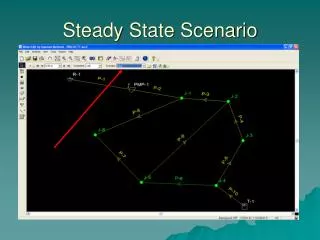
Steady state Steady State Assumptions • Dynamics are transient • At appropriate time-scales and conditions, metabolism is in steady state uptake conversion secretion A B uptake Conversion t t Two key implications • Fluxes are roughly constant • Internal metabolite concentrations are constant
Metabolic Flux Input fluxes Volume of pool of water = metabolite concentration Output fluxes Slide Credit: Jeremy Zucker
Reaction Stoichiometries Are Universal The conversion of glucose to glucose 6-phosphate always follows this stoichiometry : 1ATP + 1glucose = 1ADP + 1glucose 6-phosphate This is chemistry not biology. Biology => the enzymes catalyzing the reaction • Enzymes influence rates and kinetics • Activation energy • Substrate affinity • Rate constants Not required for steady state modeling!
Metabolic Flux Analysis Use universal reaction stoichiometries to predict network metabolic capabilities at steady state
Stoichiometry As Vectors • We can denote the stoichiometry of a reaction by a vector of coefficients • One coefficient per metabolite • Positive if metabolite is produced • Negative if metabolite is consumed Example: Metabolites: [ A B C D ]T Reactions: 2A + B -> C C -> D Stoichiometry Vectors: [ -2 -1 1 0 ]T [ 0 0 -1 1 ]T
The Stoichiometric Matrix (S) R1 R2 R3 R4 R5 R6 R7 R8 R9 R10 A B C D E F G H I -1 0 0 -2 0 0 1 0 1 0 -1 0 -1 0 0 0 1 0 Reactions Metabolites
B v1 v2 A C vin vout v4 D v3 v5 A (Very) Simple System We have introduced two new things • Reversible reactions – are represented by two reactions that proceed in each direction (e.g. v4, v5) • Exchange reactions – allow for fluxes from/into an infinite pool outside the system (e.g. vin and vout). These are frequently the only fluxes experimentally measured. v1 v2 v3 v4 v5 vin vout A B C D -1 1 0 0 0 -1 1 0 -1 0 0 1 0 0 1 -1 1 0 0 0 0 0 -1 0 0 0 -1 1 Exchange Reactions
B 0 0 v1 v2 A C vin vout 0 v4 0 1 D v3 v5 0 0 • 0 v1 • 0 v2 • 0 v3 • 0 v4 • 0 v5 • vin • 0 vout 1 0 0 0 v1 v2 v3 v4 v5 vin vout A B C D -1 1 0 0 0 -1 1 0 -1 0 0 1 0 0 1 -1 1 0 0 0 0 0 -1 0 0 0 -1 1 Given these fluxes These are the changes in metabolite concentration Calculating changes in concentration What happens if vin is 1 “unit” per second We can calculate this with S dA/dt dB/dt dC/dt dD/dt A grows by 1 “unit” per “second” =
The Stoichiometric Matrix R1 R2 R3 R4 R5 R6 R7 R8 R9 R10 = A B C D E F G H I -1 0 0 -2 0 0 1 0 1 0 -1 0 -1 0 0 0 1 0 V is a vector of fluxes through each reaction Then S*V is a vector describing the change in concentration of each metabolite per unit time
Some advantages of S • Chemistry not Biology: the stoichiometry of a given reaction is preserved across organisms, while the reaction rates may not be preserved • Does NOT depend on kinetics or reaction rates • Depends on gene annotations and mapping from gene to reactions Depends on information we frequently already have
Genes to Reactions • Expasy enzyme database • Indexed by EC number • EC numbers can be assigned to genes by • Blast to known genes • PFAM domains
Online Metabolic Databases There are several online databases with curated and/or automated EC number assignments for sequenced genomes Pathlogic/BioCyc Kegg
From Genomes to the S Matrix Examples • Columns encode reactions • Relationships btw genes and rxns • 1 gene 1 rxn • 1 gene 1+ rxns • 1+ genes 1 rxn • The same reaction can be included as multiple roles (paralogs) Gene A Gene B Gene C Gene D Gene E Gene E’ Enzyme A Enzyme B/C Enyzme D Enzyme E Enzyme E’ R1 R2 R3 R4 R5 R6 R7 R8 R9 R10 -1 0 0 -2 0 0 1 0 1 0 -1 0 -1 0 0 0 1 0 A B C D E F G H I Same rxn
What Can We Use S For? From S we can investigate the metabolic capabilities of the system. We can determine what combination of fluxes (flux configurations) are possible at steady state
1 1 3 v2 v1 v3 flux v3 1 1 3 v1 v2 v3 A C D B V Flux Configuration V Flux Configuration Rate of change of C to D per unit time 4 3 2 1 1 2 3 flux v1 1 flux v2 Flux Configuration, V Imagine we have another simple system: We want to know what region of this space contains feasible fluxes given our constraints
The Steady State Constraint • We have • But also recall that at steady state, metabolite concentrations are constant: dx/dt=0
flux v3 ? flux v1 flux v2 Positive Flux Constraint * All steady state flux vectors, V, must satisfy these constraints What region do these V live in? The solution through convex analysis *recall that reversible reactions are represented by two unidirectional fluxes
flux v3 p3 p2 p4 At steady state, the organism “lives in” here v p1 flux v1 flux v2 The Flux Cone Solution is a convexflux cone • Every steady state flux vector is inside this cone • Edges of the cone are circumscribed by Extreme Pathways
Extreme Pathways Extreme pathways are “fundamental modes” of the metabolic system at steady state They are steady state flux vectors Allother steady state flux vectors arenon-negative linear combinations flux v3 p3 p2 p4 v p1 flux v1 flux v2
B A C D b2 b1 1 1 1 1 0 0 1 1 0 0 1 1 1 1 v1 v2 v3 v4 vin vout B 1 1 v1 v2 b1 vin vout A C b2 v3 v4 D 1 1 1 1 Example Extreme Patways v1 v2 v3 v4 vin vout v1 v2 A B C D -1 1 0 0 0 -1 1 0 -1 0 0 1 1 0 0 0 0 0 -1 0 0 0 1 -1 vin vout v3 v4 All steady state fluxes configurations are combinations of these extreme pathways
flux v3 p2 p3 p4 max flux v3 p1 flux v1 flux v2 Capping the Solution Space • Cone is open ended, but no reaction can have infinite flux • Often one can estimate constraints on transfer fluxes • Max glucose uptake measured at maximum growth rate • Max oxygen uptake based on diffusivity equation • Flux constraints result in constraints on extreme pathways flux v3 p3 p2 p4 p1 flux v1 flux v2
Contains all achievable flux distributions given the constraints: Stoichiometry Reversibility Max and Min Fluxes Only requires: Annotation Stoichiometry Small number of flux constraints (small relative to number of reactions) flux v3 p2 p3 p4 p1 flux v1 flux v2 The Constrained Flux Cone
At any one point in time, organisms have a single flux configuration How do we select one flux configuration? flux v3 p2 p3 p4 p1 flux v1 flux v2 Selecting One Flux Distribution We will assume organisms are trying to maximize a “fitness” function that is a function of fluxes, F(v)?
7 5 If we choose F(v) to be a linear functionof V: The optimizing flux will always lie on vertex or edge of the cone Linear Programming Optimizing A Fitness Function ADP->ATP (v3) Imagine we are trying to optimize ATP production Then a reasonable choice for the fitness function is F(V)=v3 Goal: find a flux in the cone that maximizes v3 p2 p3 p4 p1 NADH->NADPH (v1) AMP->ADP (v2)
Start with stoichiometric matrix and constraints: Choose a linear function of fluxes to optimize: Use linear programming we can find a feasible steady state flux configuration that maximizes the F flux v3 p2 p3 p4 p1 flux v1 flux v2 Flux Balance Analysis (all i) (some j)
Z = 41.257vATP - 3.547vNADH + 18.225vNADPH + 0.205vG6P + 0.0709vF6P +0.8977vR5P + 0.361vE4P + 0.129vT3P + 1.496v3PG + 0.5191vPEP +2.8328vPYR + 3.7478vAcCoA + 1.7867vOAA + 1.0789vAKG Optimizing E. coli Growth For one gram of E. coli biomass, you need this ratio of metabolites Assuming a matched balanced set of metabolite fluxes, you can formulate this objective function
FBA Overview Stoichiometric Matrix Gene annotation Enzyme and reaction catalog Feasible Space S*v=0 Add constraints: vi>0 ai>vi>bi Optimal Flux Growth objective Z=c*v Solve with linear programming Flux solution
Applications • Knockout Phenotype Prediction • Quantitative Flux Predictions
in silico Deletion Analysis Can we predict gene knockout phenotype based on their simulated effects on metabolism? Q: Why, given other computational methods exist? (e.g. protein/protein interaction map connectivity) A: Other methods do not directly consider metabolic flux or specific metabolic conditions
B B v1 v2 v3 v4 v5 vin vout v1 v1 v2 v2 A A C C A B C D -1 1 0 0 0 -1 1 0 -1 0 0 1 0 0 1 -1 1 0 0 0 0 0 -1 0 0 0 -1 1 vin vin vout vout v4 v4 D D v3 v3 v5 v5 v1 v2 v3 v4 v5 vin vout A B C D -1 1 0 0 0 -1 1 0 -1 0 0 1 0 0 1 -1 1 0 0 0 0 0 -1 0 0 0 -1 1 in silico Deletion Analysis “wild-type” “mutant” Gene knockouts modeled by removing a reaction
Mutations Restrict Feasible Space • Removing genes removes certain extreme pathways • Feasible space is constrained • If original optimal flux is outside new space, new optimal flux is predicted Calculate new optimal flux No change in optimal flux Difference of F(V) (i.e growth) between optima is a measure of the KO phenotype
Mutant Phenotypes in E. coli PNAS| May 9, 2000 | vol. 97 | no. 10 Model of E. coli central metabolism 436 metabolites 720 reactions Simulated mutants in glycolysis, pentose phosphate, TCA, electron transport Edward & Palsson (2000) PNAS
“reduced growth” “lethal” E. coli KO simulation results If Zmutant/Z =0, mutant is no growth (-) growth (+) otherwise Compare to experiment (in vivo / prediction) 86% agree Condition specific prediction Used FBA to predict optimal growth of mutants (Zmutant) versus non-mutant (Z) Simulated growth on glucose, galactose, succinate, and acetate Edward & Palsson (2000) PNAS
What do the errors tell us? • Errors indicate gaps in model or knowledge • Authors discuss 7 errors in prediction • fba mutants inhibit stable RNA synthesis (not modeled by FBA) • tpi mutants produce toxic intermediate (not modeled by FBA) • 5 cases due to possible regulatory mechanisms (aceEF, eno, pfk, ppc) Edward & Palsson (2000) PNAS
Quantitative Flux Prediction Can models quantitatively predict fluxes and/or growth rate? • Measure some fluxes, say A & B • Controlled uptake rates • Predict optimal flux of A given B as input to model
Growth vs Uptake Fluxes Predict relationship between - growth rate - oxygen uptake - acetate or succinate uptake Compare to experiments from batch reactors Oxygen Uptake Oxygen Uptake Acetate Uptake Succinate Uptake Edwards et al. (2001) Nat. Biotech.
Specify glucose uptake Predict - growth - oxygen uptake - acetate secretion Compare to chemostat experiment Uptake vs Growth Varma et al. (1994) Appl. Environ. Microbiol.
Just An Intro!Lecture drawn heavily from Palsson Lab work http://gcrg.ucsd.edufor more info Price, Reed, & Palsson (2004) Nature Rev. Microbiology
Expression to Flux? Interpreting Array Data in Metabolic Context Clustering, GSEA Kegg, PathwayExplorer
Resources • Tools and Databases • Kegg • BioCyc • PathwayExplorer (pathwayexplorer.genome.tugraz.at) • Metabolic Modeling • Palsson’s group at UCSD (http://gcrg.ucsd.edu/) • www.systems-biology.org • Biomodels database (www.ebi.ac.uk/biomodels/) • JWS Model Database (jjj.biochem.sun.ac.za/database/index.html)
Tomorrow’s Lab • Tools • CellNetAnalyzer • Flux Balance Analysis • Applications • Predict effects of gene knockouts • Central metabolism • TB mycolic acid biosynthesis