Download
1 / 36
360 likes | 481 Views
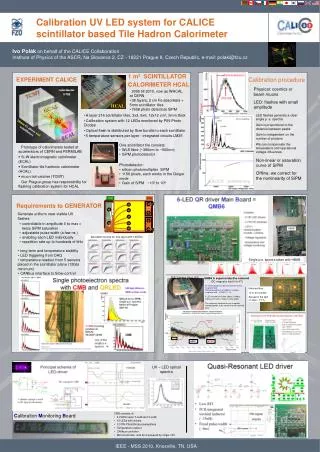
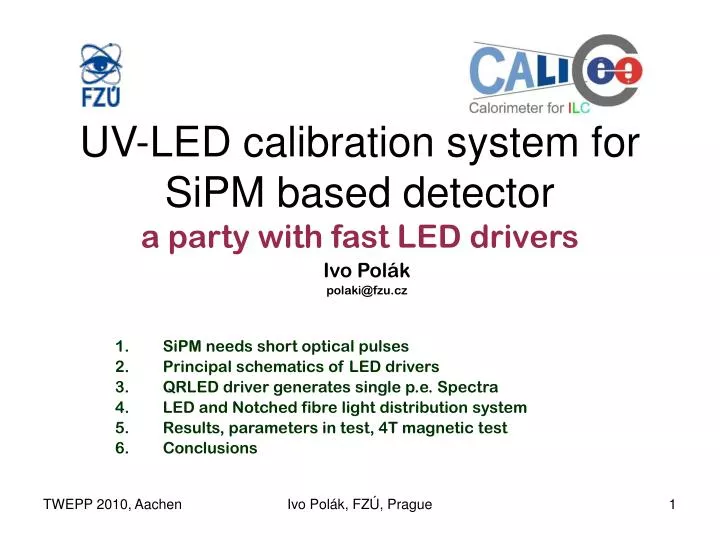
Ivo Pol á k polaki@fzu.cz SiPM needs short optical pulses Principal schematics of LED drivers QRLED driver generates single p.e. Spectra LED and Notched fibre light distribution system Results, parameters in test, 4T magnetic test Conclusions.

E N D
Ivo Polák polaki@fzu.cz SiPM needs short optical pulses Principal schematics of LED drivers QRLED driver generates single p.e. Spectra LED and Notched fibre light distribution system Results, parameters in test, 4T magnetic test Conclusions UV-LED calibration system for SiPM based detectora party with fast LED drivers Ivo Polák, FZÚ, Prague
Ivo Polák, FZÚ, Prague Requirements for calib signals to SiPM • ~400nm light flash • Short pulse in range 2 to 10ns • Tunable in amplitude • Clear end of the pulse • Stability, low jitter • Repetition rate up to hundreds of kHz • Temperature stability
Ivo Polák, FZÚ, Prague Principal schema of LED-driver My concept at CMB A classic concept as used in H1 Spacal calorimeter
Ivo Polák, FZÚ, Prague LED driver at CMB • 2 Fastest probes at the output • Short 3ns puls is shown Zoom 1:10 1ns/div
Ivo Polák, FZÚ, Prague 3 different scope probes, what we see... JULY 05 • CMB LED driver • Oscilloscope TDS5104, 1.5GHz • Probes TEK GRN 16pF 200MHz Cyan 11pF 500MHz VIO 1.5pF 3GHz • Same circuit at once P6185 passive 1kOhm 1.5pF 20x (3GHz) P5050 passive 10MOhm 11pF 500MHz 10x P2200 passive 10MOhm 16pF 200MHz 10x
Ivo Polák, FZÚ, Prague Picture of 1CH LED-driverI like breadboardingNov 2004 CMB development LED drivers part CMB development 2CH prototype
Ivo Polák, FZÚ, Prague CMB = Calibration Monitoring Board • CMB used in AHCAL CALICE 1m3 prototype • 38 layers in AHCAL detector at at three TB facilitiesDESY/CERN/FNAL (2006 to 2009) • One CMB used in Japanese SciECAL detector (TB 2009) • 12 LEDs / 12PIN PD • Steering of amplitude and pulse width of LED by T-calib and V-calib signals • Rectangular pulse width 2 ÷ 100ns can be tuned • Temperature and voltage readout in slow control, CANbus control • Relevant links: • http://www-hep2.fzu.cz/calice/files/ECFA_Valencia.Ivo_CMB_Devel_nov06.pdf
Quasi-Resonant LED driver • Less RFI • PCB integrated toroidal inductor (~35nH) • Fixed pulse-width (~4ns) PIN signal 4ns/div LED current 1V => 1A 1App Ivo Polák, FZÚ, Prague
Ivo Polák, FZÚ, Prague 6-LED QR driver Main Board = QMB6 Consists: • 6 QR LED drivers • 2 PIN PD preamps • CPU + communication module, CANbus • Voltage regulators • temperature and voltage monitoring 9
Ivo Polák, FZÚ, Prague QMB6 Linearity (V1 scan),stable in DC magnetic field 0 to 4T
Ivo Polák, FZÚ, Prague UV-LED Output optical power with QMB6 Thorlabs PM100D
Ivo Polák, FZÚ, Prague The Emission spectra of 5mm UV-LED, used in CMB
Ivo Polák, FZÚ, Prague 5mm UV LED forward V-A char YEL UV LED
Ivo Polák, FZÚ, Prague Light distributed directly by microLED to the scintillator - distributed LEDs Flashing UVLED - 2 methods of distributing at AHCAL detector • Light distributed by notched fibres smd UVLED Institute of Physics ASCR, Prague, (= FZU) Kobe University DESY Hamburg UNI Wueppertal
Ivo Polák, FZÚ, Prague Notched fiber system Notched fibre routed at HBU0, taps illuminates the scintillators via special holes • advantage – tuneable amplitude of LED light from 0 to 50 mips • Variation of LED amplitude does not affect the SiPM response readout • LED circuit and LEDs enable optical pulses with around 5ns width • Spread of light intensity from notches can be kept under 20% • disadvantage LED with control unit outside the detector volume • Notched fibre production is not trivial Nice idea, but... Spiroc1 area is not working Spiroc2 Spiroc1
Ivo Polák, FZÚ, Prague Notched fibre layoutnice blue taps shines to alignement pins Spiroc 2 area Fibre were fixed by strips of tape in position...
Ivo Polák, FZU, Prague OLD SETUP dec2009 Electrical tape and bended fibre is not the right combination! A “NEW” BALSAwood bar with a notched fibre apr2010
Setup QMB6 + HBU0(SiPM + readout) • From HBU0 (calib board): • signal T-calib LVDS only • 60ns Delay • power +15V/0.16A • CANbus slow-control • One UVLED 5mm • One Notched fibre • Almost plug and play Control: LabView 8.2 exe-file, One PC with DAQ, USB --> CAN Ivo Polák, FZÚ, Prague
Control panel of QMB6 in LabView 8.2 • Controls individual LED amplitude • LED Enables • Trigger mode ext/internal • Measure temperature • CANbus control • It can work as Exe file Ivo Polák, FZÚ, Prague
Ivo Polák, FZU, Prague Single p.e. spectra QMB6 to SPIROC1 & SPIROC0 Spread of SiPM gain is about factor 3, it corresponds to data from ITEP.
Single photoelectron spectra with CMB and QRLED LED light 400nm to SiPM on 5mmsci tile QRLed drive SiPM, single p.e. spectra taken at Prague SEP’09 • CMB in tuning position at AHCAL TB 2007 CERN CMB one of the single p.e. spectra More info about CMB can be found at: http://www-hep2.fzu.cz/calice/files/ECFA_Valencia.Ivo_CMB_Devel_nov06.pdf Ivo Polák, FZÚ, Prague
Jiří Kvasnička, FZÚ, Prague Amplitude scan corrected • Linear extrapolation of the initial slope indicate the dynamic range of ~200 MIPs • Final comments: • The estimated number of fired pixels is larger than the real number of SiPM pixels • Different shapes of saturation curve might indicate improper HG vs LG ratio • Saturation curves does not match simplef(x)=1-exp(-x) function (unsuccessful fits) • Not yet analyzed: shifts among ASIC memory cells (pedestal and data), crosstalk among memory cells, crosstalk among channels • This analyse has been made by Jiří Kvasnička.
Ivo Polák, FZÚ, Prague Test mechanical dimension, thickness of PCB on inductance test GND-plane influence Test PCBs with toroidal inductor 60 x 30 mm^2 30 x 60 mm^2 4 layers 4 PCB thicknesses: 0.8, 1.2, 1.8, 3.2mm Collaboration Meeting 11 turns 9 turns
Ivo Polák, FZÚ, Prague Top layer,pads at right are for smd capacitors 1. First to measure resonant frequency of parasitic capacitors, only. 2. To get value of L, we add larger parallel C, all 100pF with tolerance 1%, And measure the resonance frequency by GDO meter. L C C After recalculating, we can see a spread of L and parasitic C (effect of GND layer) GDO = Grid Dip Meter, handy instrument to measure resonant frequency of LC circuit
Test PCB with 10 toroidal inductors • 9 and 11 turns • 10.8 mm ODia • Pads for SMD 0805 parallel caps • 4 layer PCB, inner GND • 4 PCB thicknesses and same motive to study parameters Ivo Polák, FZÚ, Prague
Table of inductance values in MHz Test setup is proven, but more precise frequency meter (counter) is needed. Internal counter of scope TDS 2024 is the weak point. We will repeat the measurement to satisfy the precision. PCB Thickness dominates to inductance Ivo Polák, FZÚ, Prague
Toroidal PCB inductorat breadboarding phase in Brahms programme • The same PCB toroidal inductors are used at design of DC/DC convertor running on VHF. • Project Brahms, FZÚ ASCR Prague (2010 to 2012) Ivo Polák, FZÚ, Prague
QMB6 in superconductive solenoid (magnetic field 0 to 4T) DESY Hamburg, March 2009 • Air core inductor can be sensitive to external magnetic field • we performed tests of QMB6 in variable magnetic field • 3 LED flashed into 3 fibre cables • CANbus cable and T-calib + Power in other cable • The setup was mounted on non-magnetic wooden paddle, to be moved in/out of solenoid bore. • Two black end-cups were used to optically screen the setup. Details of 4TMagnetic test can be found at www-hep2.fzu.cz/calice/files/magnet5.jara_29.pdf Ivo Polák, FZÚ, Prague
Ivo Polák, FZÚ, Prague A schema of QMB6 setup in 4T magnet DUT solenoid Magnet control is not shown.
Ivo Polák, FZÚ, Prague QRLED response to magnetic field 0 ÷ 4T magnetic field temperature 4T 1.01 2T 1.00 PIN APD1 APD2 0T
Ivo Polák, FZÚ, Prague Plans for end 2010 / 2011 • Main focus: Increase of the optical performance: • Extend the pulse width from current 3.5 ns • improve optical coupling from LED into the fiber • New QR LED driver prototype • only 1 channel per board • different onboard inductors for different pulse width in range of 4 ~ 10 ns • 3cm PCB width to match the tile size • Notched fiber production (Q4/2010 – Q1/2011) • 4 sets by 3 notched fibres each with 24 notches • dimensions of the notches need to be synchronized with HBU 3 fibres receive light from 1 LED 3 x 24 = 72 notches HBU1 HBU2 HBU3 HBU4 HBU5 HBU6
Ivo Polák, FZÚ, Prague Conclusionsto common test HBU0 with QMB6 • Easy implementation, almost plug and play installation • QRLED driver has tunable light amplitude • Both methods of light distribution are tested in HBU0 EUDET prototype • With QMB6 we can see a nice single p.e. spectra • We see saturation of SiPM, but not all of them yet, better optical coupling is the key. • We would like to make more tests in the future, focusing on the optical coupling
Ivo Polák, FZÚ, Prague LED drivers Conclusion • All tested LED driver configuration are proven in test with SiPM. • QR LED driver has better EMC with fixed sinusoidal pulse width
Ivo Polák, FZÚ, Prague Back up
Blue and UV-LED, Electrical to Optical Power transformation efficiency • DC mode • Power consumption 3.3V*20mA = 66 mW • Optical power @400nm = 2.6 mW • Efficiency = 4% • Pulse mode (1Hz, 2.7ns pulse) • Power dissipation at LED = 9.75nW (very rough scope measurement) • Optical power @400nm = 0.5nW • Efficiency = 5% • Results • Flashing with 3ns pulses does not drastically affect the efficiency of transformation of electrical pulse to optical (compared to DC) • Peak pulse optical power is ~70x higher than DC 1mW -- 10mA Optical Power and Energy Meter PM100D by Thorlabs Ivo Polák, FZÚ, Prague
Ivo Polák, FZÚ, Prague Imperfectly set dumping resistor RD