Download
1 / 32
320 likes | 331 Views
Linear graphs. Information. Don’t connect 3!. Graphs parallel to the y -axis. y. x. What do these coordinate pairs have in common: (2, 3), (2, 1), (2, –2), (2, 4), (2, 0) and (2, –3)?. The x -coordinate in each pair is equal to 2.

E N D
Graphs parallel to the y-axis y x What do these coordinate pairs have in common: (2, 3), (2, 1), (2, –2), (2, 4), (2, 0) and (2, –3)? The x-coordinate in each pair is equal to 2. Look what happens when these points are plotted on a graph. All of the points lie on a straight line parallel to the y-axis. Name five other points that will lie on this line. x = 2 This line is called x = 2.
Graphs parallel to the y-axis x All graphs of the form x = c, where c is any real number, will be parallel to the y-axis and will intersect the x-axis at the point (c, 0). y x = –10 x = –3 x = 4 x = 9
Graphs parallel to the x-axis y x What do these coordinate pairs have in common? (0, 1), (4, 1), (–2, 1), (2, 1), (1, 1) and (–3, 1)? The y-coordinate in each pair is equal to 1. Look at what happens when these points are plotted on a graph. All of the points lie on a straight line parallel to the x-axis. y = 1 Name five other points that will lie on this line. This line is called y = 1.
Graphs parallel to the x-axis y x All graphs of the formy = c, where c is any real number, will be parallel to the x-axis and will intersect the y-axis at the point (0, c). y = 5 y = 3 y = –2 y = –5
Drawing graphs of linear functions The x-coordinate and the y-coordinate in a coordinate pair can be linked by a function. What do these coordinate pairs have in common? (1, –1), (4, 2), (–2, –4), (0, –2), (–1, –3) and (3.5, 1.5)? In each pair, the y-coordinate is 2 less than the x-coordinate. These coordinates are linked by the function: y = x – 2 We can draw a graph of the function y = x – 2 by plotting points that obey this function.
Drawing graphs of linear functions x –3 –2 –1 0 1 2 3 y = 2x + 5 Given a function, we can find coordinate points that obey the function by constructing a table of values. Suppose we want to plot points that obey the function y = 2x + 5 We can use a table as follows: –1 1 3 5 7 9 11 (–3, –1) (–2, 1) (–1, 3) (0, 5) (1, 7) (2, 9) (3, 11)
Drawing graphs of linear functions x –3 –2 –1 0 1 2 3 y = 2x + 5 –1 1 3 5 7 9 11 For example, y to draw a graph of y = 2x + 5: 1) Complete a table of values: y = 2x + 5 2) Plot the points on a coordinate grid. x 3) Draw a line through the points. 4) Label the line. 5) Check that other points on the line fit the rule.
Slopes of straight-line graphs y y y x x x The slope of a line is a measure of how steep the line is. The slope of a line can be positive, negative or zero. an upwards slope a horizontal line a downwards slope positive slope zero slope negative slope If a line is vertical, its slope cannot be specified. We often say the slope is “undefined”.
Calculating the slope (x2, y2) (x1, y1) change in y change in x x If we are given any two points (x1, y1) and (x2, y2) on a line we can calculate the slope of the line as follows: y rise slope = = run y2 – y1 To help you find this more easily, you can draw a right triangle between the two points on the line. x2 – x1 y2 – y1 slope = x2 – x1
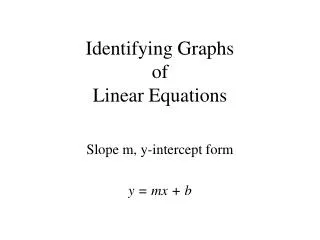
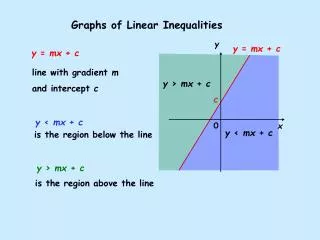
The general equation of a straight line The general equation of any straight line is: This is called the slope-interceptform of a straight line equation. y = mx + b The value of m tells us the slope of the line. The value of b tells us where the line crosses the y-axis. This is called the y-interceptand it has the coordinates (0, b). For example, the line y = 3x + 4 has a slope of 3 and crosses the y-axis at the point (0, 4).
Rearranging to y = mx + b 1 2 –x + 4 y = 2 y = –x + 2 Sometimes the equation of a straight line graph is not given in slope-intercept form, y = mx + b. The equation of a straight line is 2y + x = 4. Find the slope and the y-intercept of the line. Rearrange the equation by performing the same operations on both sides. 2y + x = 4 2y = –x + 4 subtract x from both sides: divide both sides by 2:
Rearranging to y = mx + b y = –x + 2 m = so the slope of the line is . y b = 2 and so the y-intercept is (0, 2). 1 1 1 2 2 2 – – x Rearranging to y = mx + b Once the equation is in slope-intercept form, y = mx + b, we can determine the value of the slope and the y-intercept. 1 y = – x + 2 2
Substituting values into equations A line with the equation y= mx + 5 passes through the point (3, 11). What is the value of m? To solve this problem, we can substitute x = 3 and y = 11 into the equation y = mx + 5. This gives us: 11 = 3m + 5 6 = 3m subtract 5 from both sides: 2 = m divide both sides by 3: m = 2 The equation of this line is therefore y = 2x + 5.
Parallel lines –6x + 1 y = 2 If two lines have the same slope, they are parallel. Show that the lines 2y + 6x = 1 and y = –3x + 4 are parallel. We can show this by rearranging the first equation so that it is in slope-intercept form,y = mx + b. 2y + 6x = 1 2y = –6x + 1 subtract 6x from both sides: divide both sides by 2: y = –3x + ½ The slope m is –3 for both lines, so they are parallel.
Perpendicular lines 1 1 1 4 4 4 y = x– 5 If the slopes of two lines have a product of –1, then they are perpendicular. if the slope of a line is m, then the slope of the line perpendicular to it is – . 1 In general, m Write down the equation of the line that is perpendicular to y = –4x + 3 and passes through the point (0, –5). The slope of the line y = –4x + 3 is –4. The slope of the line perpendicular to it is therefore . The equation of the line with slope and y-intercept –5 is:
Music Download Prices Investigate the cost of these music download services: Yes Trax$9.99 per month$0.49 per song Z-Tunes: No monthly charge. $0.99 per song hi-notes:$12.95 per month, $0.79 per song MP3 House: $19.99 per month, no charge per song Write the monthly cost of each service as a function of the number of songs downloaded. Compare the services with a graph and a table.
Customs trap A customs officer suspects that two boats will meet to transfer smuggled goods. Using radar he writes down their coordinates at 5pm and 6pm. The first boat is at (–32.64, –29.82) at 5pm, and at (–10.05, –9.64) at 6pm. The second boat is at (105.64, 30.98) at 5pm and (77.18, 31.06) at 6pm. Sketch their paths on a graph, and write equations for these lines. Where should the officer expect the boats to meet?
Customs trap graph The equations for the two boats’ paths are: First boat: y = 0.89x – 0.77 Second boat: y = 31.28 Here is a graph of their paths. y (35.89, 31.28) 60 50 Their meeting occurs at the intersection of the lines. y = 31.28 40 30 20 y = 0.89x – 0.77 10 At approximately what time should the officer expect the boats to meet? 90 100 –30 –20 –10 10 20 30 40 50 60 70 80 x –10 –20 –30 –40