Download
1 / 5
0 likes | 11 Views
Dive deep into the realm of data interpretation and storytelling, where Business Data Visualization isn't just about aesthetics but about making complex data accessible and clear. Visualization is an art blending function with design to highlight essential insights. In our data-rich age, mastering Dashboard Visualization isn't a luxuryu2014it's a necessity. Doing so not only clarifies dense data but bridges the gap between information and strategic action. Elevate your insights and steer your business forward.

E N D
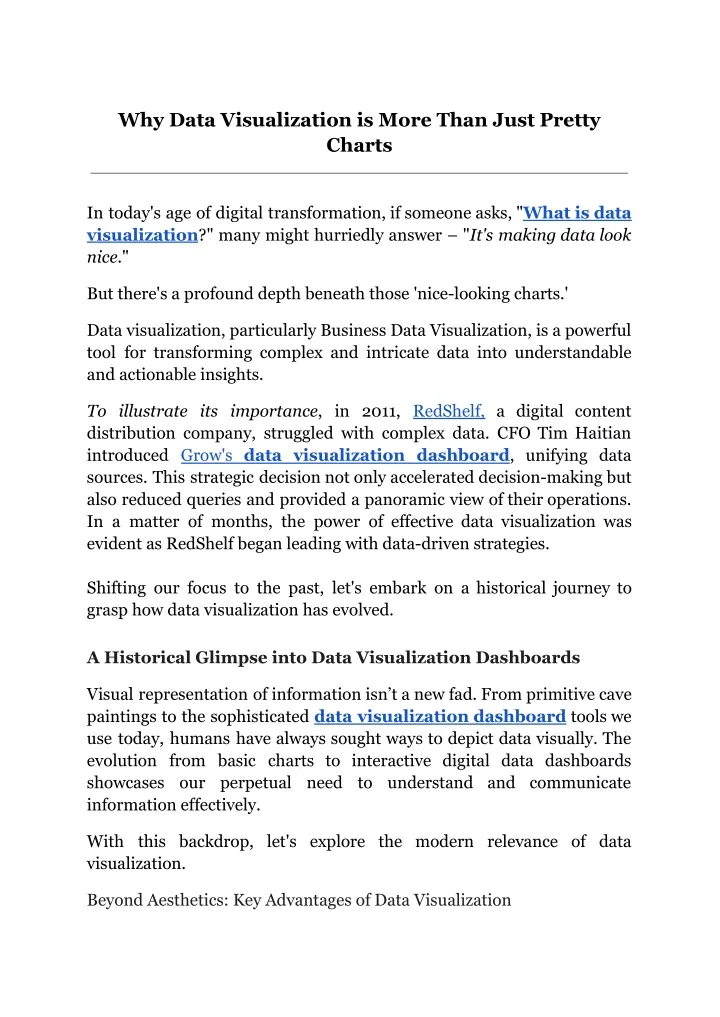
Why Data Visualization is More Than Just Pretty Charts In today's age of digital transformation, if someone asks, "What is data visualization?" many might hurriedly answer – "It's making data look nice." But there's a profound depth beneath those 'nice-looking charts.' Data visualization, particularly Business Data Visualization, is a powerful tool for transforming complex and intricate data into understandable and actionable insights. To illustrate its importance, in 2011, RedShelf, a digital content distribution company, struggled with complex data. CFO Tim Haitian introduced Grow's data visualization dashboard, unifying data sources. This strategic decision not only accelerated decision-making but also reduced queries and provided a panoramic view of their operations. In a matter of months, the power of effective data visualization was evident as RedShelf began leading with data-driven strategies. Shifting our focus to the past, let's embark on a historical journey to grasp how data visualization has evolved. A Historical Glimpse into Data Visualization Dashboards Visual representation of information isn’t a new fad. From primitive cave paintings to the sophisticated data visualization dashboard tools we use today, humans have always sought ways to depict data visually. The evolution from basic charts to interactive digital data dashboards showcases our perpetual need to understand and communicate information effectively. With this backdrop, let's explore the modern relevance of data visualization. Beyond Aesthetics: Key Advantages of Data Visualization
Beyond the mere visual appeal, Business Data Visualization holds the key to unveiling valuable insights, fostering innovation, and driving informed decision-making. Here, we dive into the captivating world of data visualization and uncover its profound advantages. 1. Storytelling with Data: Business Data compelling narratives communication and engages audiences effectively. Visualization via transforms and complex data simplifies into charts graphs. This For example, Spotify employs a Data Visualization Dashboard to craft narratives about its user base. It has a 'Wrapped' feature, an interactive data visualization, allowing users to discover their top songs, artists, and music genres throughout the year. Similarly, tools like Grow’s can spotlight often-overlooked yet vital data points, guiding more insightful decisions. 2. Cognitive Benefits and Complexity Simplified: Data visualization capitalizes on our brain’s inherent ability to process visual information faster than text, simplifying the intrinsic complexity in vast datasets. In fact, the human brain interprets visual information 60,000 times more rapidly than text. This simplifies the intrinsic complexity in vast datasets, meaning not only do we comprehend the data faster, but the essence of even the most intricate data sets becomes accessible to those without a technical background.
3. Increased Accessibility: Understanding Cloud-powered Data Visualization Dashboards make complex data accessible to all, regardless of expertise. This ensures that essential insights are readily available to everyone in an organization, regardless of location. intricate data isn't exclusive to data scientists. For instance, Edit Suits Co., a luxury menswear brand, expanded to London and Singapore, and they encountered data management challenges. However, Grow Business Data Visualization streamlined operations by consolidating KPIs into a single dashboard, overcoming geographic limitations. 4. Decision-Making Advantage: Dashboard visualization tools enable companies to expedite their decision-making processes, giving them a competitive advantage. Studies show businesses leveraging data visualization dashboards can make decisions and react to market changes up to five times faster than industry averages.
Many industries, like stock trading, airlines, hotels, and online retailers, depend on real-time data for rapid market adjustments and strategy adaptations driven by variables such as current events, weather, and customer trends. Real-time insights are critical for efficient market monitoring in these dynamic sectors. 5. Enhanced Data Exploration: The interactive Data Visualization Dashboard makes it easy to explore datasets. Businesses can delve into specific data points and apply filters, empowering business teams to examine data from various perspectives. Notably, companies with advanced considerable benefits in their operations and decision-making. They are: analytics capabilities reap ● 2x more likely to be in the top quartile of financial performance in their sectors. ● 2x more likely to harness decision-making processes. ● 3x more likely to implement decisions as planned. ● 5x more likely to make prompt decisions, much faster than their market counterparts. data frequently during their Consider 2 Brothers, a moving and delivery service-oriented company, faced with numerous data metrics. However, with Grow's customizable dashboards, they effectively tackled prioritized key performance indicators (KPIs) for a more focused and effective data exploration. this problem. They've now Grow’s interactive dashboards allow users to drill, filter down, and manipulate views as per their requirements. 6. Emotional Impact and Contextual Embedding: An effective visualization is more than just a representation – it embeds context and can evoke emotions. For instance, a chart depicting a rise in sales during the holiday season might bring about feelings of accomplishment and motivation, making the data more relatable and the insights more memorable.
Conclusion In the data-saturated landscape we navigate, a Data Visualization Dashboard serves as our compass, directing us toward unseen insights and innovations. Implementing business intelligence that harnesses data visualization capabilities can yield a remarkable return on investment, delivering $13.01 for every dollar spent, as reported by Nucleus Research. But the challenge lies in cherry-picking the right visual elements to resonate with the dataset and audience. With the right resources and tools, this task becomes less daunting. Want to harness the full potential of data visualization for your business? Explore Grow’s suite of cutting-edge Dashboard Visualization tools with user-friendly interfaces, robust analytics, and seamless integration. Quickly transform your data into actionable insights, streamline decision-making, and gain a competitive edge. Get in touch at Grow.com to kickstart your 14-day free Grow demo! Dive into Grow Features & Capabilities GetApp for an appropriate picture of its efficiency and consumer feedback.