Download
1 / 15
150 likes | 281 Views
A Toll Choice Probability Model Application to Examine Travel Demand at Express and Electronic Toll Lanes in Maryland. By Sabyasachee Mishra (University of Memphis) Birat Pandey (Baltimore Metropolitan Council) Timothy Welch (University of Maryland )

E N D
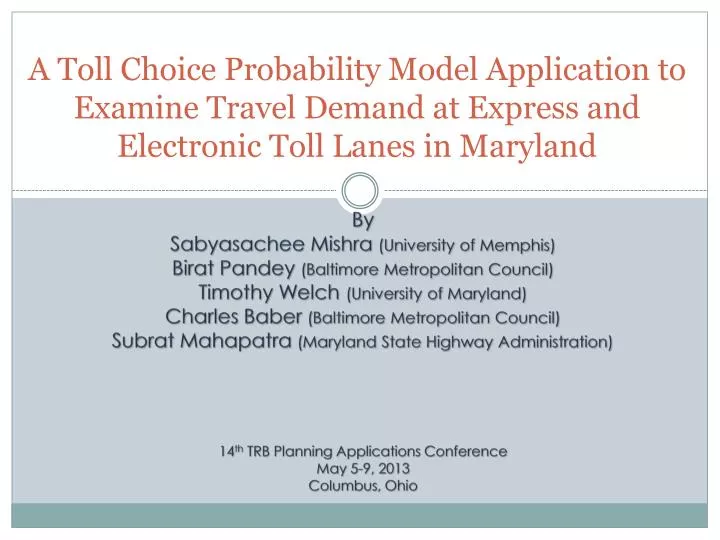
A Toll Choice Probability Model Application to Examine Travel Demand at Express and Electronic Toll Lanes in Maryland By Sabyasachee Mishra (University of Memphis) Birat Pandey (Baltimore Metropolitan Council) Timothy Welch (University of Maryland) Charles Baber (Baltimore Metropolitan Council) Subrat Mahapatra (Maryland State Highway Administration) 14th TRB Planning Applications Conference May 5-9, 2013 Columbus, Ohio
Motivation • Enhance existing work • Previous toll diversion models: all-or-nothing path choice decision • Disaggregate VOT in mode choice and traffic assignment • Binary choice logit(probabilistic) model • Analytical tool capable of producing detailed tolled facility use • Better decision support tool
Background Ranked 5th in Population Density Ranked 19th in Population(5.8 million, 2010) By 2040, Maryland will have 1.1 million more people, and 0.4 million more jobs
Travel Model Structure Regional Model National/State/MPO Land Use Forecasts FAF 3 NHTS Statewide Model SE Data Reconciliation Person Travel Trucks Person Long-Distance Travel Model Trip Generation Trip Generation Flow Estimation Trip Distribution Trip Distribution Disaggregation Mode Choice IItrips IItrips Time of day split EI/IE/EEtrips EI/IE/EE trips Urban ModelReconciliation Multiclass Assignment
Toll Share Toll Share = 1/ (1 + eα*ΔT + β*Cost/ln(Inc) + c + etcbias) Where e = Base of natural logarithm (ln) ΔT = time saving between toll road and non-toll road travel, in minutes Cost = toll cost in dollars Inc= household annual income (in thousands) α = time coefficient β = cost coefficient c = toll road bias constant etcbias= bias towards selecting toll routes with ETC payment
Scenarios • Two scenarios are also examined. • 20% increase of 2030 • 50% increase of 2030 • Comparison is presented in • Toll trip origins • Toll trip destinations • Elasticity of income classes
Toll Trip Origins Scenario-I 20% Increase Scenario-II 50% Increase
Toll Trip Destinations Scenario-I 20% Increase Scenario-II 50% Increase
Summary • An enhancement over previous toll diversion models • The proposed model recognizes variations in traveler’s decision to utilize a toll road by incorporating a probabilistic model. • Estimated likely toll road users are assigned to assess the toll traffic as a path choice decision between toll road and non-tolled roads. • The estimated toll traffic on several toll facilities is slightly lower than observed • higher sensitivity to toll cost
Thank You Acknowledgement