Download
1 / 1
10 likes | 126 Views
Hydrological sensitivity to green house gases and aerosols in CESM Maria M. Kvalevåg , Bjørn H. Samset and Gunnar Myhre Center for International Climate and Environmental Research – Oslo (CICERO), Norway. Results contd. Results. Introduction

E N D
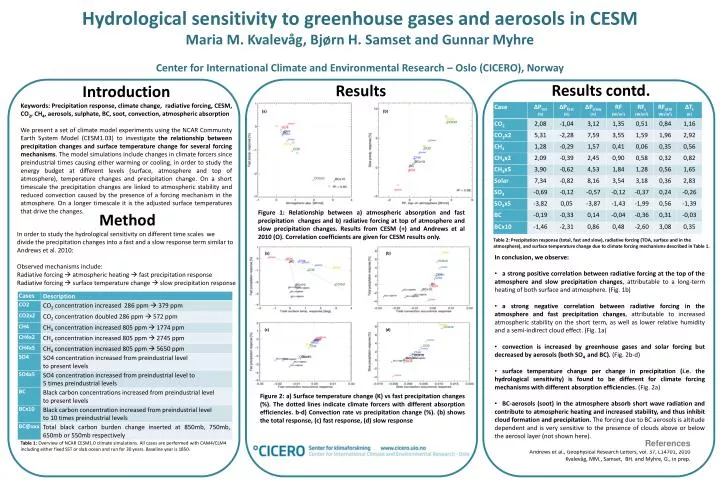
Hydrologicalsensitivity to greenhousegases and aerosols in CESMMaria M. Kvalevåg, Bjørn H. Samset and Gunnar MyhreCenter for International Climate and Environmental Research – Oslo (CICERO), Norway Results contd. Results Introduction Keywords: Precipitation response, climate change, radiative forcing, CESM, CO2, CH4, aerosols, sulphate, BC, soot, convection, atmospheric absorption We present a set of climate model experiments using the NCAR Community Earth System Model (CESM1.03) to investigate the relationship between precipitation changes and surface temperature change for several forcing mechanisms. The model simulations include changes in climate forcers since preindustrial times causing either warming or cooling, in order to study the energy budget at different levels (surface, atmosphere and top of atmosphere), temperature changes and precipitation change. On a short timescale the precipitation changes are linkedto atmospheric stability and reduced convection caused by the presence of a forcing mechanism in the atmosphere. On a longer timescale it is the adjusted surface temperatures that drive the changes. (a) (b) Figure 1: Relationship between a) atmospheric absorption and fast precipitation changes and b) radiative forcing at top of atmosphere and slow precipitation changes. Results from CESM (+) and Andrews et al 2010 (O). Correlation coefficients are given for CESM results only. Method In order to study the hydrological sensitivity on different time scales we divide the precipitation changes into a fast and a slow response term similar to Andrews et al. 2010: Observed mechanisms include: Radiative forcing atmospheric heating fast precipitation response Radiative forcing surface temperature change slow precipitation response Table 2: Precipitation response (total, fast and slow), radiative forcing (TOA, surface and in the atmosphere), and surface temperature change due to climate forcing mechanisms described in Table 1. (a) (b) • In conclusion, we observe: • a strong positive correlation between radiative forcing at the top of the atmosphere and slow precipitation changes, attributable to a long-term heating of both surface and atmosphere. (Fig. 1b) • a strong negative correlation between radiative forcing in the atmosphere and fast precipitation changes, attributable to increased atmospheric stability on the short term, as well as lower relative humidity and a semi-indirect cloud effect. (Fig. 1a) • convection is increased by greenhouse gases and solar forcing but decreased by aerosols (both SO4 and BC). (Fig. 2b-d) • surface temperature change per change in precipitation (i.e. the hydrological sensitivity) is found to be different for climate forcing mechanisms with different absorption efficiencies. (Fig. 2a) • BC-aerosols (soot) in the atmosphere absorb short wave radiation and contribute to atmospheric heating and increased stability, and thus inhibit cloud formation and precipitation. The forcing due to BC aerosols is altitude dependent and is very sensitive to the presence of clouds above or below theaerosol layer (not shown here). (c) (d) Figure 2: a) Surface temperature change (K) vsfast precipitation changes (%). The dotted lines indicate climate forcers with different absorption efficiencies. b-d) Convection rate vs precipitation change (%). (b) shows the total response, (c) fast response, (d) slow response Table 1: Overview of NCAR CESM1.0 climate simulations. All cases are performed with CAM4/CLM4 including either fixed SST or slab ocean and run for 30 years. Baseline year is 1850. References Andrews et al., Geophysical Research Letters, vol. 37, L14701, 2010 Kvalevåg, MM., Samset, BH. and Myhre, G., in prep.