Download
1 / 1
10 likes | 119 Views
Water vapour estimates over Antarctica from 12 years of globally reprocessed GPS solutions • Ian Thomas, Matt King, Peter Clarke • Newcastle University, UK • email : ian.thomas@ncl.ac.uk •. Introduction

E N D
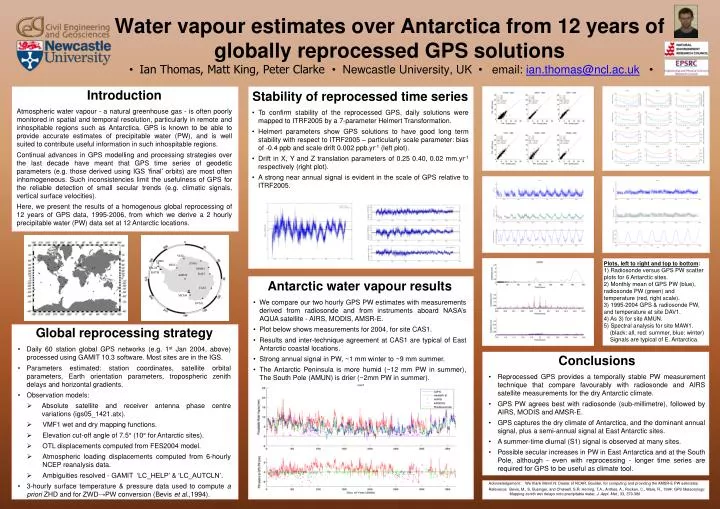
Water vapour estimates over Antarctica from 12 years of globally reprocessed GPS solutions• Ian Thomas, Matt King, Peter Clarke • Newcastle University, UK • email: ian.thomas@ncl.ac.uk• Introduction Atmospheric water vapour - a natural greenhouse gas - is often poorly monitored in spatial and temporal resolution, particularly in remote and inhospitable regions such as Antarctica. GPS is known to be able to provide accurate estimates of precipitable water (PW), and is well suited to contribute useful information in such inhospitable regions. Continual advances in GPS modelling and processing strategies over the last decade have meant that GPS time series of geodetic parameters (e.g. those derived using IGS ‘final’ orbits) are most often inhomogeneous. Such inconsistencies limit the usefulness of GPS for the reliable detection of small secular trends (e.g. climatic signals, vertical surface velocities). Here, we present the results of a homogenous global reprocessing of 12 years of GPS data, 1995-2006, from which we derive a 2 hourly precipitable water (PW) data set at 12 Antarctic locations. • Stability of reprocessed time series • To confirm stability of the reprocessed GPS, daily solutions were mapped to ITRF2005 by a 7-parameter Helmert Transformation. • Helmert parameters show GPS solutions to have good long term stability with respect to ITRF2005 – particularly scale parameter: bias of -0.4 ppb and scale drift 0.002 ppb.yr-1 (left plot). • Drift in X, Y and Z translation parameters of 0.25 0.40, 0.02 mm.yr-1 respectively (right plot). • A strong near annual signal is evident in the scale of GPS relative to ITRF2005. VESL Plots, left to right and top to bottom: 1) Radiosonde versus GPS PW scatter plots for 6 Antarctic sites. 2) Monthly mean of GPS PW (blue), radiosonde PW (green) and temperature (red, right scale). 3) 1995-2004 GPS & radiosonde PW, and temperature at site DAV1. 4) As 3) for site AMUN. 5) Spectral analysis for site MAW1. (black: all, red: summer, blue: winter) Signals are typical of E. Antarctica. OHIG SYOG BELG PALM MAW1 ROTH DAV1 AMUN • Antarctic water vapour results • We compare our two hourly GPS PW estimates with measurements derived from radiosonde and from instruments aboard NASA’s AQUA satellite - AIRS, MODIS, AMSR-E. • Plot below shows measurements for 2004, for site CAS1. • Results and inter-technique agreement at CAS1 are typical of East Antarctic coastal locations. • Strong annual signal in PW, ~1 mm winter to ~9 mm summer. • The Antarctic Peninsula is more humid (~12 mm PW in summer), The South Pole (AMUN) is drier (~2mm PW in summer). CAS1 MCM4 DUM1 . • Global reprocessing strategy • Daily 60 station global GPS networks (e.g. 1st Jan 2004, above) processed using GAMIT 10.3 software. Most sites are in the IGS. • Parameters estimated: station coordinates, satellite orbital parameters, Earth orientation parameters, tropospheric zenith delays and horizontal gradients. • Observation models: • Absolute satellite and receiver antenna phase centre variations (igs05_1421.atx). • VMF1 wet and dry mapping functions. • Elevation cut-off angle of 7.5° (10° for Antarctic sites). • OTL displacements computed from FES2004 model. • Atmospheric loading displacements computed from 6-hourly NCEP reanalysis data. • Ambiguities resolved - GAMIT ‘LC_HELP’ & ‘LC_AUTCLN’. • 3-hourly surface temperature & pressure data used to compute a priori ZHD and for ZWD→PW conversion (Bevis et al.,1994). • Conclusions • Reprocessed GPS provides a temporally stable PW measurement technique that compare favourably with radiosonde and AIRS satellite measurements for the dry Antarctic climate. • GPS PW agrees best with radiosonde (sub-millimetre), followed by AIRS, MODIS and AMSR-E. • GPS captures the dry climate of Antarctica, and the dominant annual signal, plus a semi-annual signal at East Antarctic sites. • A summer-time diurnal (S1) signal is observed at many sites. • Possible secular increases in PW in East Antarctica and at the South Pole, although - even with reprocessing - longer time series are required for GPS to be useful as climate tool. • Acknowledgement: We thank Merrit N. Deeter of NCAR, Boulder, for computing and providing the AMSR-E PW estimates. • Reference: Bevis, M., S. Businger, and Chiswell, S.R, Herring, T.A., Anthes, A., Rocken, C., Ware, R., 1994: GPS Meteorology: Mapping zenith wet delays onto precipitable water, J. Appl. Met., 33, 379-386