Download
1 / 3
30 likes | 162 Views
Full View of Energy Supply and Demand Narrative (note that the following slide contains embedded links). Site. Back of the envelope energy consumption. Building layout. eQuest Electricity Demand. 54,423 kWh/yr. eQuest Heat Demand. 120 MMBtu/yr. eQuest Natural Gas Demand. Natural Gas

E N D
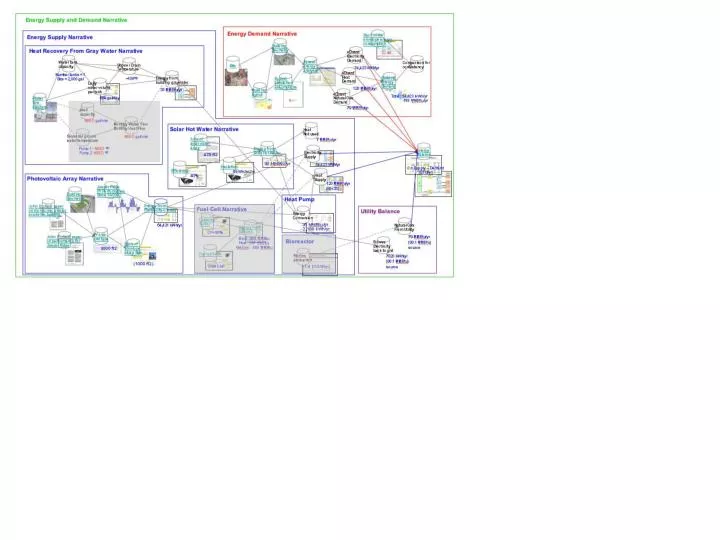
Full View of Energy Supply and Demand Narrative (note that the following slide contains embedded links)
Site Back of the envelope energy consumption Building layout eQuestElectricityDemand 54,423 kWh/yr eQuestHeatDemand 120 MMBtu/yr eQuest Natural Gas Demand Natural Gas From Utility HeatNot used ElectricitySupply ExcessElectricityback to grid John Scofield paper on monitoring a solar academic building 79 MMBtu/yr(80.1 MMBtu) source 79 MMBtu/yr 7 MMBtu/yr 7820 kWh/yr(80.1 MMBtu)source 54,423 kWh/yr HeatSupply 120 MMBtu/yr(85+35) John Scofield paper on performance forJasper Ridge PV size and type Energy Balance 3000 ft2 0 = Supply – Demand[BTU/yr] Energy Supply and Demand Narrative Energy Demand Narrative Energy Supply Narrative Building geometry Heat Recovery From Gray Water Narrative Water tank capacity Comparison for consistency Equest energy analysis Shower DrainTemperature Energy from building graywater Number tanks = 1Size = 2,000 gal Building Energy Demand Equest simulation assumptions ~100ºF Daily water volume per tank 35 MMBtu/yr Total: 54,423 kWh/yr 199 MMBtu/yr Water flow diagram 680 gal/day Well capacity Monthly Water Flow Monthly Heat Flow NEED gal/min Solar Hot Water Narrative Seasonal ground water temperature NEED gal/min Area of solar water array Energy from Solar Hot Water Pump 1: NEEDF Pump 2 NEED F 475 ft2 Insolation 92 MMBtu/yr Efficiency 5kWh/m2d 40% Photovoltaic Array Narrative Jasper Ridge PV Performance Since 10/2002 Building Geometry Heat Pump Energy from Photovoltaic Array Fuel Cell Narrative Energy Conversion Utility Balance Capacity factor Energy from fuel cell 64,431 kWh/yr 35 MMBtu/yr - 2,188 kWh/yr Cf = 90% Elect: 404 MMBtu Heat: 296 MMBtu NatGas: -389 MMBtu Bioreactor Back of Envelope Array Size Fuel cell size BioGas production (1000 ft2) 5KW CHP ~1.4 [m3/day]
Caption for Energy Narrative • The Energy Supply and Demand Narrative is a snapshot of the status of the design of the energy systems for the Stanford Green Dorm by the end of the Feasibility Study (mid February, 2006). It reflects the alternatives discussed, analyzed and discarded to achieve a Zero Energy Goal, one of the product functional requirements requested by the owner. • The Energy Narrative has three types of sub-narratives: the Energy Supply Narrative (blue); the Energy Demand Narrative (red) and the Utility Balance Narrative (purple). The first is divided into other sub-narratives which are the different sources of energy explored during the design to provide on-site energy generation. The second is the narrative describing the model-base demand of the building calculated using eQuest with a set of assumptions about the use, size, shape and material properties of this living lab. The third is a simple narrative that shows the energy exchange with the utilities (electricity and natural gas). • The Energy Supply Narrative is subdivided into six narratives. Each of them details the sources of onsite energy generation explored during the feasibility study to match the energy demand. The two grayed-out narratives (fuel cell and bioreactor) denote two alternatives explored, but not included in the energy balance to achieve the zero energy goal. Their dependencies with the overall energy balance are shown with dashed lines to point out what their potential impact could be. • The perspectives labeled “NEED” denote information that is missing. It usually correspond to discussions held within the design team, but that didn’t translate into formalized design alternatives.