Download
1 / 44
480 likes | 759 Views
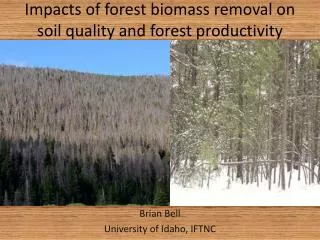
Biomass, Productivity and Allocation. Lectures 11 &12. I. Production Ecology. Introduction

E N D
Biomass, Productivity and Allocation Lectures 11 &12
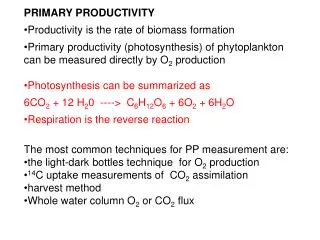
I. Production Ecology • Introduction The study of production ecology focuses on the production and allocation or organic matter by plants and animals. Egler was the first to coin the term production ecology when he studied the effects of climate on the growth of corn. This specialized area of study in ecology is important from an economic and ecological standpoint. Biomass is a quantity or amount of organic matter per unit area(i.e. biomass and organic matter are the same). Biomass is approximately 50% carbon. Production is the rate of increase of organic matter per unit area per unit time
Production Ecology • Introduction Egler first coined the term production ecology and begun the studies of ecosystem energetics in a cornfield. ii. Levels of Study Leaf • CO2 + H2O(CH2O)n +O2 (photosynthesis) • Trade off between photosynthesis and respiration • Tree • All tree components • Ecosystem • Photoautotophs, heterotrophs and consumers • Global • Study of C flow at a large scale • Terrestrial, aquatic, atmospheric • Modeling
II. Forest Biomass. i. Estimation of Aboveground Biomass a. Area harvest • Ease?
II. Forest Biomass. i. Estimation of Aboveground Biomass b. Mean tree approach • Biomass of area based on the DBH of average trees • 10 trees, DBH’s of 9,9,9,12,12,12,12,15,15,15 • Biomass 100kg of average trees x 10 trees =10,000 kg/unit area • Accuracy?
II.Forest Biomass. i. Estimation of Aboveground Biomass c. Allometry • Relationship between dependent variable (tissue biomass) and independent variable (DBH) Log10 B = A + B(Log10DBH)
Allometry: General How To’s • Survey the stand/plot • Ranges of DBH • Select most representative trees • Good canopy • “normal” growth form • Mark trees for measurement • Measure DBH, total tree height, canopy thirds, • Weigh the wet biomass components • Get a ratio of wet to dry mass of each tissue • Use this data to get a dry tissue mass • Related dbh to mass of tissue
Forest Biomass: aboveground: allometry • Best to use allometric equations that you develop
Forest Biomass: Estimation of Aboveground • Allometry • Log10 B = A + B(Log10DBH) • Could use a linear equation that makes it easy to relate OR some researchers might use an exponential curve
ii. Factors influencing aboveground biomass • 1) Stand age • Biomass increases with age • More to come during succession lectures • 2) Climate • Harsh climates have less biomass
Factors influencing aboveground biomass • 3) Water availability • Foliage mass/LAI proportional to water availability • Why? What happens to the plant during water stress? • Other physiological processes • Reduced cell elongation • Reduced protein synthesis
ii. Factors influencing aboveground biomass Gower et al. 1992. Ecol. Monogr • 4) Nutrient availability • Biomass (especially foliage) is related to limiting nutrients • 5) Leaf habit • Evergreen have greater foliage mass • Why?
II. Forest Biomass. iii. Estimation of belowground biomass a. Coarse roots • Often estimated using allometric relations • Allometric equations are derived from coarse root excavation using high pressure water, dynamite, or machinery • Follows trends of aboveground biomass
II. Forest Biomass. iii. Estimation of belowground biomass a. Fine roots. No agreed upon definition, but generally < 3-5 mm diameter Root cores minirhizotrons
ii. Estimating coarse root biomass • Water excavation and development of allometric equations
II. Forest Biomass. iv. Factors influencing belowground biomass a. Stand age • Would an older stand or a younger stand have more fine root? Why?
II.Forest Biomass. iv. Factors influencing belowground biomass b. Nutrient availability • More fine roots on nutrient poor sites • Why?
II. Forest Biomass. iv. Factors influencing belowground biomass c. Water availability • Fine root biomass inversely related to water content. Why? • Wood chips: • What might cause limits to biomass accumulation? • Why was below ground biomass low on fertilization?
d. Effect of leaf habit on fine root biomass In general, evergreen trees allocate or support more fine roots than deciduous trees.
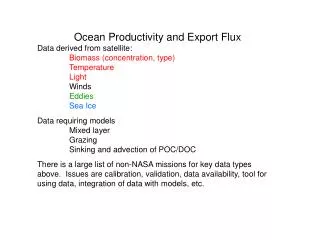
III. Net Primary Production and Carbon Allocation Different commodities have different units to quantify yield. For example, bushels of corn, board feet, cubic volume, etc. Ecologists used a standard: dry matter produced per unit area, per unit time (e.g. t/ha/yr)
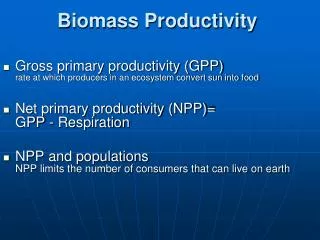
III. Net Primary Production and Carbon Allocation • Definitions • Gross Primary Productivity (GPP): Total amount of carbon assimilated by plants per unit area and time. GPP is always positive, GPP is very difficult to measure. b. Net Primary Productivity (NPP); Net amount of carbon assimilated by plants per unit area and time. NPP = GPP - RA where RA is autotrophic respiration - NPP can range from 0 to + - Secondary Productivity refers to the productivity of consumers that feed off producers. c. Carbon Allocation - refers to the priority in which photosynthate is partitioned in the plant.
Biomass allocation • Foliage • Stem and branches • Reproduction • Coarse roots • Fine roots • Mycorrhizae • Defense compounds • Storage • Respiration
Gross Primary Production (GPP) and Net Ecosystem Production (NEP) for major forest biomes of the world (from Gower 2003). Data are from eddy flux towers that measure CO2 exchange between vegetation and the atmosphere.
GPP RA NPP RH RROOTS III. Productivity and Carbon Allocation • Net Ecosystem Productivity (NEP) • Measure of the change of the in the total organic matter (living and dead) in the ecosystem per unit area and time • NEP = GPP - Ra- Rh • NEP = NPP - Rh • Rh = respiration heterotroph (microbes) • So, NEP is the amount of change or the total amount of carbon assimilated minus the loss of respiration (CO2) from plants and microbes. • If NEP is positive the terrestrial ecosystem is a C sink, and if NEP is negative then the terrestrial ecosystem is a C source.
III. Net Primary Production (NPP) and Carbon Allocation • Estimation of aboveground NPP • Repeated plot harvest • Allometry and repeated stem measurements Where NPP = ∆B + D + H ∆B = delta biomass D = NPP lost as detritus production H = NPP lost to herbivory
III. Net Primary Production (NPP) and Carbon Allocation iii. Estimation of belowground NPP Douglas-fir (PNW) Fine root mass Black spruce (MB) winter spring summer fall winter
III. Net Primary Production (NPP) and Carbon Allocation iv. Factors Influencing NPP and Carbon Allocation • Temperature • Water • Nutrient availability • Leaf Habit
0.23 0.46 0.31 0.32 Gower et al. 1992 Ecol. Monogr
III. Net Primary Production (NPP) and Carbon Allocation v. Factors Influencing Autotrophic Respiration • Temperature • Biomass allocation
Effect of light and nitrogen availability on vigor of Salix (willow)
Factors affecting Carbon allocation • 1) Nutrient availability • Fine root biomass is inversely related to the limiting nutrient in the stand (N or P) • 2) Water availability • Inverse relationship between water and BNPP • 3) Leaf habit • Conifers allocate more C to fine roots than deciduous • SUMMARY: Site water balance sets the maximum amount of leaf area a site can support. The maximum LAI may not be achieved if nutrient limitation occurs. Nutrient availability is the primary control on where the photosynthate (I.e. biomass) is allocated.
Production Efficiency (PE) • Definition: Amount of carbon produced per unit leaf area or foliage mass • Factors influencing PE • Light • Water • Nutrient availability
PE LAI LAI Production efficiency and vigor NPP Why does PE decrease in relation to LAI while NPP increases?????
Growth efficiency/Production efficiency Why did the difference in treatment disappear? Note: rate of wood production generally decreases with inc. LAI because sharing of resources
Growth efficiency and beetles -dark circles= death due to attacks -open circle=living tissue after attacks What is going on????
Growth efficiency and stressors • Densely stocked stands • Are susceptible to environmental stressors • What would the growth efficiency be? • If we remove trees we can see that the trees will be “thriftier” • Changes in allocation of “photosynthate”
GPP RA NPP RH RROOTS Net Ecosystem Production (NEP)NEP = NPP - RH • Definition: • Measure of the change of total organic matter (living and dead) per unit area and time • Factors influencing: • Climate • Disturbance
Universal: Young forests have greater annual C sequestration rates while mature forests store more C