Download
1 / 9
90 likes | 236 Views
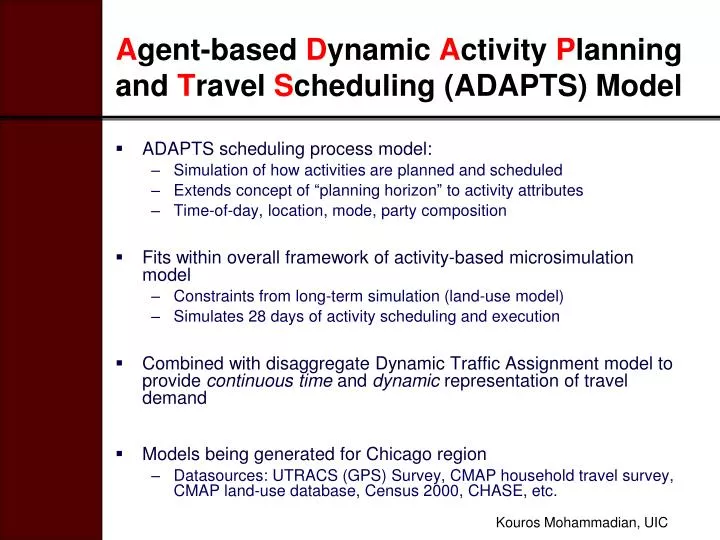
A gent-based D ynamic A ctivity P lanning and T ravel S cheduling (ADAPTS) Model. ADAPTS scheduling process model: Simulation of how activities are planned and scheduled Extends concept of “planning horizon” to activity attributes Time-of-day, location, mode, party composition

E N D
Agent-based Dynamic Activity Planning and Travel Scheduling (ADAPTS) Model • ADAPTS scheduling process model: • Simulation of how activities are planned and scheduled • Extends concept of “planning horizon” to activity attributes • Time-of-day, location, mode, party composition • Fits within overall framework of activity-based microsimulation model • Constraints from long-term simulation (land-use model) • Simulates 28 days of activity scheduling and execution • Combined with disaggregate Dynamic Traffic Assignment model to provide continuous time and dynamic representation of travel demand • Models being generated for Chicago region • Datasources: UTRACS (GPS) Survey, CMAP household travel survey, CMAP land-use database, Census 2000, CHASE, etc. Kouros Mohammadian, UIC
Information Flow Simulation Flow ADAPTS Simulation Framework This process is repeated for each individual for 15 minute timesteps for 28 simulated days. More detailed representation of region needed here Dynamic traffic assignment with detailed network representation Kouros Mohammadian, UIC
Results and Visualization • ADAPTS gives a (near) continuous time representation • Origin-destination flows at 15 minute intervals and, • Trip purposes, mode types, etc. for each trip • Continuous time representation of link loads • Results are highly disaggregate • Sensitive to many policies impacting behavior • Makes visualization and interpretation difficult • Therefore, need visualization techniques to communicate results of analysis effectively • 3D city model combined with disaggregate activity data gives high quality, detailed picture of regional travel, policy implications, etc. Kouros Mohammadian, UIC
Current Results Visualization Movie Kouros Mohammadian, UIC
UTRACS: Urban Travel Route and Activity Choice Survey • Internet enabled and entirely automated • Participants upload data to central server • Survey completed on same day as data acquisition • Scans data to generate interactive PR survey • Utilize Google Maps API • Activity timeline • Participants validate activity/travel episodes • Survey activity-travel attributes • Who with, planning horizons, location choices, route and mode choice decisions • Incorporate learning algorithms to reduce survey burden • Suggest answers known with some confidence • Remove questions when answers known with high confidence • Proactively identify likely upcoming activities and prompt for planning data • Pre-populate planning items for learned recurrent activities Kouros Mohammadian, UIC
Demonstration:Activity-travel verification Kouros Mohammadian, UIC
Demonstration:Activity Episode Questions Kouros Mohammadian, UIC
Demonstration:Travel Episode Questions Kouros Mohammadian, UIC
Current Status of UTRACS Survey • Completed initial implementation of survey on 100 households between April and December 2009 in Chicago • Data on over 4500 trips and nearly 5000 individual activities • Detailed data regarding activity planning and scheduling process • Updates to UTRACS design • Port survey code to smartphones / PDAs to remove need for separate data acquisition device • Real-time transmission of data to server to reduce processing time • Potential future applications of UTRACS • Route choice, wayfinding behavior observations • Evaluation of how LBS, mobile, targeted ads, etc. can influence behavior Kouros Mohammadian, UIC