Download
1 / 15
150 likes | 241 Views
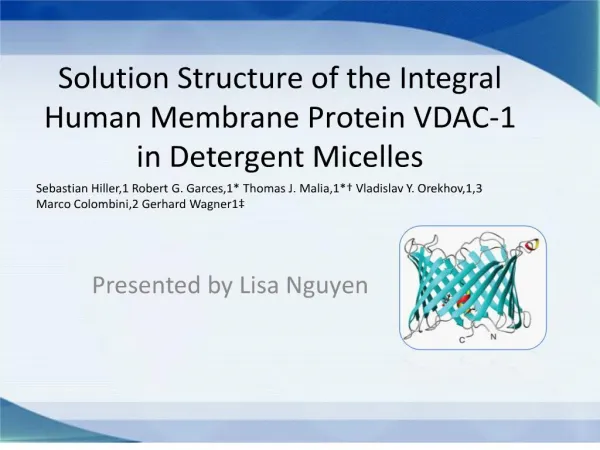
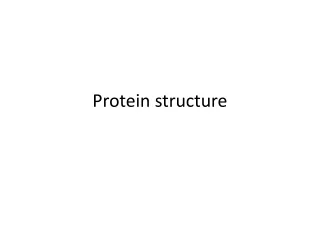
The Estimation of Protein Structure in Solution . Using Circular Dichroism. Norma J. Greenfield. email: normaljg@gmail.com. [ q ] X 10 -3 , deg • cm 2 /dmol. 80. a-. helix. 60. b. -sheet. Type 2 turn. Random coil. 40. Poly-L-proline II (P2). 20. 0. -20. -40. -60. 190. 200.

E N D
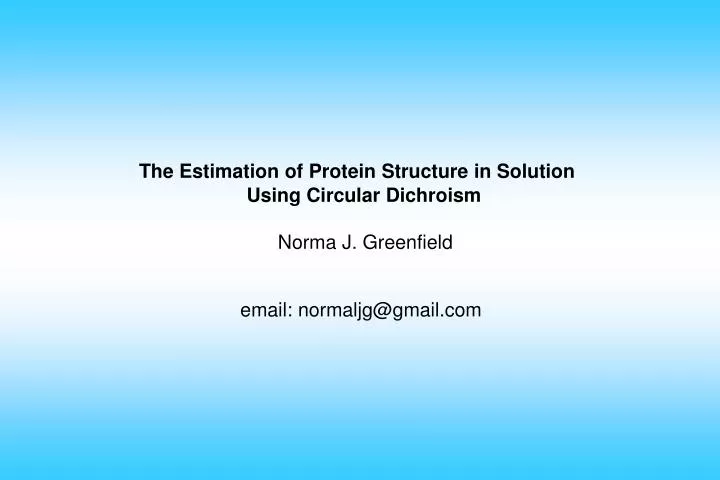
The Estimation of Protein Structure in Solution Using Circular Dichroism Norma J. Greenfield email: normaljg@gmail.com
[q]X 10-3, deg • cm2 /dmol 80 a- helix 60 b -sheet Type 2 turn Random coil 40 Poly-L-proline II (P2) 20 0 -20 -40 -60 190 200 210 220 230 240 250 Wavelength, nm
Determination of Protein Concentration Good Methods: 1. Quantitative amino acid composition. 2. Determination of backbone amide groups using the microbiuret method. 3. Determination of moles of tyrosine using difference spectroscopy under denaturing conditions. 4. Determination of total nitrogen. Not Acceptable: 1. Bradford Method. 2. Lowry Method. 3. Absorbance at 280 and/or 260.
Buffer Systems for CD Analyses Acceptable: (1) Potassium Phosphate with KF, K SO or (NH ) SO 2 4, 4 2 4 as the salt. (2) Hepes, 2 mM. (3) Ammonium acetate, 10 mM. Avoid: Tris. NaCl. Anything optically active e.g. glutamate.
Linear Regression This method assumes that the CD spectrum of a protein can be represented by a linear combination of the spectra of the secondary structural elements, plus a noise term which includes the contribution of aromatic chromophores. = 3 F S + noise 2 8 i 8 i where is the CD of the protein as a function of wavelength, 2 8 F is the fraction of each secondary structure, i, and S is the i 8 i ellipticity at each wavelength of each ith secondary structural element. In constrained fits the sum of all the fractional weights, 3 F , must be equal to 1. Linear regression is useful i for evaluating the effects of mutations, ligands and solvents on protein conformation.
Standards for Linear Regression . 1. Polypeptides with known conformations (Greenfield and Fasman, Brahms and Brahms). 2. Standard spectra extracted from a data base of known proteins using the method of least squares (Saxena and Wetlaufer, Yang and coworkers). 3. Standard spectra extracted from a data base of proteins with known conformations using the convex constraint algorithm (Fasman and coworkers).
Non-Constrained Least Squares Analysis (MLR) Advantages: 1. Don’t need to know protein concentration. 2. Invariant standards. Drawbacks: 1. Very poor estimate of beta sheet and turns. 2. Overestimates -sheet if data below 200 nm is used. $ Wavelength -helix ß-sheet ß-Turn " Range P P P F F F 240-178 0.91 0.13 0.43 0.21 0.07 0.16 240-200 0.92 0.14 0.74 0.16 0.23 0.16
Constrained Least Squares Analyses ( Constrained Least Squares Analyses (Lincomb) Advantages: Advantages: 1. Invariant data base (useful for direct comparisons). 2. Better fits than non-constrained least squares method. Disadvantages: 1. No good single standard for -turns. $ 2. Not as good as more modern methods. Wavelength -helix ß-sheet ß-Turns " Range P P P F F F Peptide standards 240-178 0.93 0.11 0.58 0.15 0.61 0.11 240-200 0.94 0.11 0.71 0.13 0.53 0.14 Standard curves extracted from 33 proteins 240-178 0.96 0.08 0.73 0.13 0.38 0.11 240-200 0.95 0.08 0.57 0.15 0.11 0.18
Ridge Regression (Contin) Contin, developed by Provencher and Glöckner, fits the CD of unknown proteins by a linear combination of the spectra of a large data base of proteins with known conformations. In this method the contribution of each reference spectrum is kept small unless it contributes to a good agreement between the theoretical best fit curve and the raw data. Advantage: Relatively good estimate of -turns. $ Drawback: References are different for every fit. Wavelength -helix ß-sheet ß-Turn " Range P P P F F F 260-178 0.93 0.11 0.56 0.15 0.58 0.08 240-200 0.95 0.13 0.60 0.15 0.74 0.07
Singular Value Decomposition (SVD) SVD, developed by Hennessey and Johnson, extracts basis curves with unique shapes from a set of spectra of proteins with known structures. The basis curves are each characterized by a mixture of secondary structures, and are then used to analyze the conformation of unknown proteins. The sum of weights is not constrained to equal 1. Advantage: Best estimate of -helical content of proteins. " Problem: Poor fit of -sheet and turns if data are not collected to $ at least 184 nm. Wavelength -helix ß-sheet ß-Turn " Range P P P F F F 260-178 0.98 0.05 0.62 0.18 0.39 0.18 240-200 0.97 0.08 0.43 0.14 0.04 0.13
Variable Selection (VARSLC). In variable selection an initial large data base of proteins with known spectra and secondary structures is selected. Some of the protein spectra are then eliminated systematically to create new data bases with a smaller number of standards. SVD is performed using all of the reduced data sets and the ones fulfilling selection criteria for a good fit are averaged. Advantage: Superior Fits. Disadvantage: Very slow. Wavelength -helix ß-sheet ß-Turn " Range P P P F F F 260-178 0.97 0.07 0.81 0.10 0.60 0.07
Self Consistent Method (Selcon, CDPro) The SELCON program of Sreerama and Woody is a modification of VARSLC that is faster to use. With suitable references, the SELCON program can be used to estimate the contribution of the P2 conformation in proteins and the length of helical and segments. $ Advantage: Good estimates of -sheet and turns in proteins. $ Drawback: Poor fits of spectra of polypeptides with high b-sheet sheet content. Wavelength -helix ß-sheet ß-Turn " Range P P P F F F 260-178 0.95 0.09 0.84 0.08 0.77 0.05 240-200 0.94 0.09 0.73 0.09 0.84 0.05
) Neural Networks ( CDNN and K2D A neural network is an artificial intelligence program which can detect patterns and correlations in data. Two widely used programs are the CDNN program of Böhm et al. and the K2D program of Andrade et al. A neural network is first trained using a set of known proteins so that the input of the CD at each wavelength results in the output of the correct secondary structure. The trained network is then used to analyze unknown proteins. The method works very well and the fits seem to be relatively independent of the wavelength range. Wavelength -helix ß-sheet ß-Turn " Range P P P F F F 0.93 0.10 0.73 0.11 0.82 0.05 260-178 (CDNN) 0.95 0.09 0.77 0.10 ND 240-200 (K2D)
Convex Constraint Algorithm (CCA) The CCA algorithm deconvolutes a set of spectra into a desired number of basis spectra, which when recombined generate the entire data set with a minimum deviation between the original data set and the reconstructed curves. It is very useful for determining whether there are intermediate states in thermal and perturbant denaturations. The method has also be used to estimate protein conformation, but is poorer than least squares, SVD or neural net analyses. Wavelength -helix ß-sheet ß-Turn " Range P P P F F F 260-178 0.96 0.10 0.62 0.18 0.39 0.18 240-200 0.97 0.10 0.42 0.20 0.52 0.22
Which Program Should I Use? Recommendations: 1. For determination of globular protein conformation in solution: SELCON, CDNN and K2D. 2. For determination of polypeptide conformation: LINCOMB with a suitable polypeptide set of references. 3. For determining the effects of mutations, ligands and perturbants on protein structure: LINCOMB. 4. For evaluating the number of folding states giving rise to a set of spectra: The CCA algorithm and SVD.