Download
1 / 21

E N D
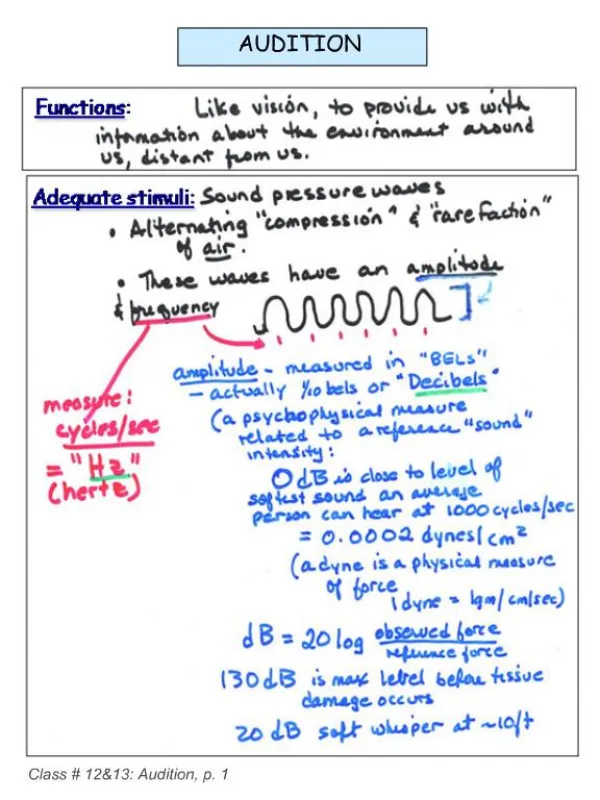
As we shift our focus from the acoustic characteristics of speech sounds to the linguistic percepts that the acoustic input evokes in the listeners, we first need to consider the physicaland psychophysical properties of the human auditory system.The capabilities of this system are remarkable. For example, we can hear a sound which causes eardrum to move only one-tenth the diameter of a hydrogen molecule.
AUDITORY PHYSIOLOGY OUTER EARThe outer ear consists of the pinna and the auditory canal (external auditory meatus). The auditory canal is a resonator, and can be compared to a uniform tube closed at one end and open at the other.Note: to calculate the resonant frequencies of the auditory canal, we would use the same formula that we used for calculating the resonant frequencies of the vocal tract in a neutral configuration. The auditory canal is about 2.5 cm (~1 inch) long, giving us:c * (2n - 1) = 34,400 / 4 x 2.5 = ~ 3440 Hz 4lThe pressure at the eardrum for frequencies in this region can be 2-4 x greater than at the canal entrance. To think about:What consequences might this have (if any) for sound systems?
MIDDLE EARThe auditory canal ends at the eardrum or tympanic membrane. The sound pressure at the drum displaces the drum, which in turn causes displacement of the bones (ossicles) of the middle ear: the malleus, incus, and stapes. These bones are suspended by ligaments in the air-filled middle ear cavity. The mechanical vibrations of the auditory ossicles are transmitted to the oval window, a membrane that covers the opening to the inner-ear cochlea.Worth noting: The fluid-filled cochlea is more resistant than air to movement so, all else being equal, most of the sound energy transmitted to the oval window would be reflected back. But all else isn’t equal: the oval window is smaller than the eardrum; since pressure = force/area, this size difference results in increased pressure at the window. Also, the incus behaves like a fulcrum to the (smaller) stapes, increasing pressure at the oval window.
INNER EARThe inner ear is a system of cavities in the bones of the skull which influence balance as well as hearing. The cavity that houses the sensory receptor for hearing is the cochlea, where the mechanical vibrations of the middle ear and oval window are transformed into nerve impulses.The cochlea is a fluid-filled coiled cavity. The vibration of the endplate of the stapes against the oval window results in pressure waves in the cochlear fluid, which in turn set the cochlear duct --and the basilar membrane within the duct --into vibration.
Oval window scala vestibuli basal end apical end scala tympani Round window Cochlear duct scala vestibuli Organ of Corti scala tympani Basilar membrane The uncoiled cochlea: The basilar membrane is narrow and stiff at the basal (oval window) end, where it responds with greatest amplitude to high frequencies. At the apical end, where it is thicker and less stiff, the greatest amplitude of response is to low frequencies.
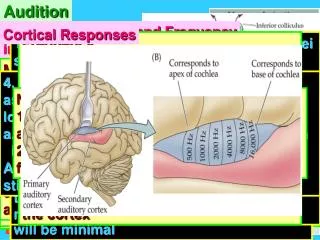
Thus the basilar membrane is a spectrum analyzer, performing a kind of Fourier analysis on input complex waves albeit with limited power of resolution.The basilar membrane’s response to input frequencies is non-linear: a larger portion of the basilar membrane responds to sounds in the 0-1000 Hz range than, for example, in the 10000-11000 Hz range. This non-linearity has psychoacoustic consequences: human listeners are more sensitive to differences in the lower than in the higher frequencies. (We’ll return to this point shortly.)Like the digital filters we discussed last time, the cochlea’s response has a time-frequency trade-off: the basal end (which responds to high frequencies) provides poorer frequency but better time resolution while the apical end (which responds to low frequencies) does the opposite. To think about: How does this time-frequency trade-off relate to what we know about speech sounds? Which speech sounds have primarily high frequency energy? Low frequencies? Which have rapidly changing acoustic characteristics?
The mechanical vibration of the basilar membrane is converted into signals that are transmitted to the auditory cortex in the Organ of Corti, which lies along the length of the basilar membrane. The Organ of Corti consists of rows of thousands of hair cells which are innervated by ~30000 nerve fibers. Movement of the basilar membrane causes deflection of the endings of the hair cells through contact with the tectorial membrane, which excites the nerve fibers in that region.
BASIC PSYCHOACOUSTICSPsychoacoustics is concerned with the psychological (subjective) correlates of the physical parameters of acoustics. So we turn now to consideration of the sensations that sounds evoke in the listener.While we are centrally interested in the sensations that the complex waves of speech evoke, much of the work on psychoacoustics has been based on non-speech stimuli such as pure tones.
Absolute threshold: the minimum detectable level of a sound under ideal conditions.Absolute threshold for pure tones:Humans are most sensitive to sounds in the 1-5 kHz range; i.e., in this range we hear sounds that have a relatively low sound pressure level (SPL). Particular sensitivity at 3-4 kHz is due to the lowest frequency resonance of the ear canal (which we calculated above at 3440 Hz).Below 1 kHz the threshold increases gradually (i.e., intensity must be increased for listeners to detect the sound) and above ~10 kHz the threshold increases sharply.
The auditory threshold curve was determined on the basis of relatively long tones (500 ms or longer).At shorter durations, the threshold increases, but in a frequency-dependent way. For example, at lower frequencies, the threshold increases at ~ 400 ms but in the frequency region of greatest sensitivity it doesn’t begin to increase until ~ 200 ms (Stevens, 1998, Acoustic Phonetics).
LOUDNESS and INTENSITYThe sensation of loudness correlates closely with the intensity of a sound.From the most to the least intense sound that the human ear can hear (without damage!), the ratio of intensities is 1,000,000,000,000:1(B.C.J. Moore, An Introduction to the Psychology of Hearing).But the subjective loudness differences that sounds evoke in listeners is nowhere near that great. Therefore, a commonly used scale for measuring intensity, the decibel scale (dB), reflects the nonlinearity of loudness perception.
Po Pr Decibel ScaleDecibel: unit of measurement of relative intensity of a sound, compared to an arbitrary reference pointIntensity: magnitude of sound expressed in pressure or power.Pressure: force per area (unit = dynes/cm2)Power: rate at which energy expended (unit = watts/cm2); proportional to the square of the pressureReference point:auditory threshold @ 1 kHz = 0 dB = 0.0002 dynes/cm2 (pressure) = 10-16 watts/cm2 (power)Decibel formula for pressure: dB SPL = 20 ( log10 ) where Po = output intensity and Pr = reference intensity
For comparison…Ratio LogdB (20 x log of ratio)1000:1 3 60 dB SPL e.g., conversation 100:1 2 40 dB SPL e.g., quiet office 10:1 1 20 dB SPL e.g., faint whisper 1:1 0 0 dB SPL absolute threshold
Equal and relative loudness scales:The decibel scale is not sensitive to the effects of frequency on the sensation of loudness. For example, a 300 Hz and a 3000 Hz tone at 50 dB differ substantially in loudness.Phon: The phon scale is determined by having listeners adjust the intensity of a 1000 Hz tone until it has the same loudness as a comparison tone of a different frequency. Sounds judged to have equal loudness in this way are assigned the same “phon” value (e.g., all tones judged as having the same loudness as a 20 dB 1000 Hz tone have a loudness of 20 phons). Sone: The sone scale is determined by having listeners adjust the loudness of a tone until it is twice as loud, or half as loud, as another tone. 1 sone = loudness of a 40 dB 1000 Hz tone. 2 sones = sound judged to be 2x as loud as this.
PITCH AND FREQUENCYJust as the relation between loudness and intensity is non-linear, so is the relation between pitch and frequency.Mel: The mel scale is based on experiments with pure tones in which listeners adjust the frequency of a test tone to be half as high (or twice as high) as that of a comparison tone.1000 mel = pitch of 1000 Hz tone500 mel = pitch of tone that sounds half as high 2000 mel = pitch of tone that sounds twice as high The mel scale corresponds closely to the Hz scale up to ~500 Hz. At higher frequencies, the mel scale is more nearly logarithmic.
Bark: The Bark scale is a critical band scale. In considering critical bands, we turn first to the principles of frequency selectivity and masking (see B.C.J. Moore’s An Introduction to the Psychology of Hearing for an excellent overview).Frequency selectivity is the human auditory system’s ability to resolve the components of complex sounds. Masking refers to the conditions under which one sound is made inaudible or masked by the presence of another sound (the masker). Put another way, under masking, the audibility threshold of one sound is raised by the presence of another sound (the masker). Because signals are most easily masked by sounds whose frequencies are the same as, or close to, those of the signal, masking reflects the limits of frequency selectivity: masking occurs when the selectivity of the auditory system fails to separate signal and masker.
In this experimental paradigm, the critical band is the BW at which the signal threshold flattens out. Signal Threshold (dB) Masker Bandwidth (Hz) Fletcher (1940) presented listeners with a pure tone signal plus a noise masker whose bandwidth (BW) was varied. (The noise was centered at the frequency of the pure tone.) He found that as the noise BW increased, so did the signal threshold: that is, a more intense signal was needed for it to be detectable through the noise.So far no surprise, but what’s interesting is that this finding held only up to a certain point: at some noise BW, the threshold function flattens off and further increases in noise BW do not affect the signal threshold.Schematically:
Over the past 60+ years, numerous other experiments have provided further evidence of critical bands. The current view (e.g., Syrdal & Gopal, 1986, Journal of the Acoustical Society of America 79) is that the auditory system is composed of a series of bandpass filters with overlapping bandwidths. A critical band, then, is the bandwidth of each internal filter. As the center frequencies of the critical bands increase, so do their bandwidths.Physiologically, each critical band corresponds to a distance on the basilar membrane (1.3 mm according to Syrdal and Gopal). This is in keeping with what we’ve already seen: recall that a larger portion of the basilar membrane responds to low frequencies than to higher frequencies, and human listeners are more sensitive to differences in the lower than in the higher frequencies (see p. 52 of Johnson’s book).
Bark: Zwicker (1961) divided the human auditory range below 16 kHz into 24 critical bands or Barks. One of the more widely used frequency-to-Bark approximations is that of Zwicker & Terhardt (1980) (given in Syrdal & Gopal, 1986, JASA vol. 79). The bark scale, like the mel scale, is essentially linear up to about 500 Hz and is nearly logarithmic above 500 Hz.
JUST NOTICEABLE DIFFERENCES (JNDs)How small of a difference in frequency, intensity, or duration can the human auditory system detect? The answer depends on the type of input signal. In general, JNDs are larger for speech or speech-like stimuli than for pure tones or, in some cases, noise. Some examples from K.N. Stevens’ Acoustic Phonetics (1998) are:Loudness JNDS:Pure tones or wideband noise at amplitudes in the speech range: 0.3-1.0 dBAmplitude of F2 in a vowel with equally spaced formants: ~ 3 dBPitch JNDs:Pure tones (normal listening levels): ~ 1 Hz for frequencies up to 1 kHz; ~ 2 Hz at about 2 kHz and ~ 4 Hz at about 4 k Hz Increases rapidly above 5 kHzF2: 20-100 Hz, depending on the F1-F2 or F2-F3 distance