Download
1 / 34
340 likes | 499 Views
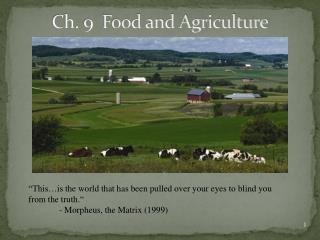
Chapter 9 Agriculture. Introduction. Agriculture results in major environmental impacts 8.5 to 16.5 Pg CO 2 e/ yr (17 to 32% of total released) N 2 O and enteric methane major contributors N 2 O from fertilizer Enteric fermentation from animals Growing meat consumption

E N D
Introduction • Agriculture results in major environmental impacts • 8.5 to 16.5 Pg CO2e/yr(17 to 32% of total released) • N2O and enteric methane major contributors • N2O from fertilizer • Enteric fermentation from animals • Growing meat consumption • N2O emissions growing
9.2 Problems with LCA in Ag • Widely varying practices • Lack data sources of individual processes like seen in a factory • Differences in soils • N2O emissions strongly influenced by soil moisture • Big thing is co-products • Prime beef, regular, mechanically recovered, hides, tallow, etc.
9.3 Sugarcane • Different crops for sugar production • Generally want the highest return ($/ha) • Farmers can shift to different crops and rotations according to prices • Multiple uses for sugar crops • Ethanol • Sugar • Combustion of fiber
9.3 Sugarcane • Cradle to grave assessment using Ecoindicator 95 • Functional unit tonne of sugar leaving mill • Impact categories • Energy MJ • GHGE kg CO2eq • Acidification potential (g sulphateequiv) g SO4-2eq • Eutrophication potential (g phosphate eq) g PO4-3eq • Fresh water use kL
Initial Findings • Crop production dominates environmental burdens – relative to processing • Two problems • Variability in crop production systems • Many of the environmental impacts dominated by dynamic soil process • These processes are not very well understood • Linked it with a soil model on N uses
Variability – Sensitivity Analysis • Three scenarios allow for an average and 2 extreme results • Handled by looking at state average farming system • Wet tropics scenario (low N, no irrigation, lower cane yield) • High yield scenario (high N and irrigation)
Allocation of Inventory Flows • Co-products handled with economic allocation and system expansion • Using economic allocation • Raw sugar (96%) and molasses (4%) • 143 kg sugar and 26 kg molasses per tonne cane • $300/tonne sugar and $70/tonne for molasses
System Expansion • Difficulty with equivalence when dealing with substitution of the coproducts • Molasses replaces 40% barley (supplement pasture), 20% of wheat (ethanol fermentation), and 40% nothing (attractant for cattle) • Results almost identical for each allocation approach
Other Allocation Options • Mass • Divide allocation by mass of products and co-products • 169 kg of products per tonne of cane, sugar is 85% of mass • Energy • Look at energy value of each product and co-product • Split allocation by energy output • Maybe a little difficult with DDGS versus ethanol
Results • Agricultural activities biggest factor, processing minor • Eutrophication potential • Emissions to air ammonia, N2O and NOx • Water emissions primarily due to nitrate NO3-, phosphate, PO4 • Differences due to climate, soil type • High yield and low yield cases resulted in similar energy yields
Areas for Data Improvements • Environmental conditions – climate, soil type, topography • Agronomic practices • Geographic location relative to supporting infrastructure
Conclusions • Variability should be considered carefully in ag crop production, particularly with environmental impacts • Traditional LCA models an average process, agriculture makes this difficult • Opportunity for quick LCA’s on field scale • Optimized sugar cane production, not necessarily best use of land • Some production practices are difficult to change – peoples behavior
9.4 Milk Production • Conventional milk versus ultra high temperature (UHT) milk • UHT is heated very quick and hot relative to conventional milk • Shelf life of 6 to 9 months • Stable at room temperature
Results – % of Total Energy UHT is higher overall in energy. This is due to the longer transport distances, not as many processing plants.
9.5 Maize to Maize Chips • Considers soil GHG balances (including N application) and extends system to include processing • Functional unit 400 g packet of corn chips • Measurement unit were kg CO2eq/packet
Measurements • Went to processing facility • On-Farm measurements of N2O • Previous 5 years focused on stubble and soil carbon dynamics • Looked at following N fertilization • Zero N and stubble burned • 329 kg N/ha and stubble burned • 329 kg N/ha and stubble tilled into soil
Results • 6% of emissions are pre-farm (mfg inputs) • 36% on-farm • N fertilization largest GHGE on-farm • 58% post-farm • Electricity for processing biggest factor • Boxes, transport and oil large factors also
Comments on Fig 9.3 • Pre and on-farm operations add $0.4/kg CO2 eq • Processing has $2/kg CO2eq • Pre and on-farm are adding less value per unit of GHGE • Makes it harder to invest in abatement strategies • Electricity, packaging, and transport maybe a bigger impact per dollar
9.6 Food Miles • Local versus global food production • Idea is that local food with minimal transport is more environmental friendly • Two issues • Food production is about more than transportation • Assumes transport is dominate environmental impact in food production systems • In general, transport of raw foods relatively small
Food Mile Studies • Some studies indicated that shipping tomatoes from Spain instead of greenhouses in the UK was less impact • Some areas have advantages in crop production – New Zealand has year round grazing • Shipping fruit from the other hemisphere might be better than storing for 1 year
Differences in Shipping • Ambient shipping by sea low impact (although bunker fuel is very dirty) • Road trucking in refrigerator trailers is energy intensive • Air would be even worse
CSA Impact • May minimize some of the negative impact relative to conventional food systems • Less chemical use, less erosion, less packaging, fewer food miles, and more crop and ecosystem diversity • However, few systematic and complete LCA’s to justify these statements
9.7.1 Ag Sustainable • Ag is a major problem (emitter) and potential savior (biofuels and carbon sinks) • LCA useful for comparison different options for a similar product or service • Wool and nylon (nylon actually better, but not natural)
9.7.2 Constraints on LCA Applications to Ag Systems • Climate change impacts on ag pests, diseases, crop growth, yields, and water poorly understood • Time boundaries – fertilizer or lime available over multiple years • Most systems are “established” land use change “water under the bridge”
LCA and Ag Systems • Timing and nutrient cycles poorly understood • Land clearing • Fuel use on farm • Fertilizer • Water • N2O • Some studies have indicated that biofuels were worse than fossil fuels due to N2O • This focused on GHGE • Might need more of the eco-indicator type analysis (chapter 5)
Ketchup Example • Wide variation in tomato cultivation phase • Production of ketchup fairly well defined • Use at home a problem • Bottle in refrigerator for 1 year had 90% more embodied energy than a bottle used in 1 month • Room for “quick” LCA tools for on-farm/field use
9.7.3 Issues Beyond LCA and Interface Between Other Decision Tools • Two apple production systems is a fair use • Other factors would include rural landscape, natural heritage, wildlife diversity • LCA will have trouble with some of these factors • Economic factors • Food production is high in the US and EU (20% of land is set aside) • Potential food problems in the future
Key Questions • What is limiting • Land • GHGE • Water • Will vary by geographic location • LCA need for evaluating conventional and new ag systems • Look for maximum societal benefits
9.8 Conclusions • Ag LCAs are important • Land use, water use • GHGE • Pollutants • Fertilizer, N2O • LCA can help with counterintuitive results • Food miles • Natural versus synthetic
Ag Stakeholders • Need to be effort to educate stakeholders on the roll of LCA • Calculators need to be made available for farmers • Economic impact and GHGE (corn chip example) • Less income derived from farm side than processing