Download
1 / 33
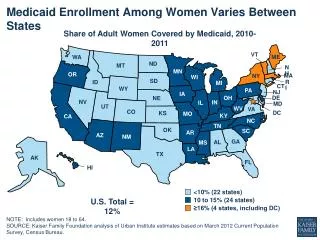
330 likes | 421 Views
A Longitudinal View of Child Enrollment in Medicaid. Alan E. Simon . Co-Authors. Anne K. Driscoll Yelena Gorina Jennifer Parker Kenneth C. Schoendorf. Disclosures. No financial disclosures or conflicts of interest. Disclaimer.

E N D
A Longitudinal View of Child Enrollment in Medicaid Alan E. Simon
Co-Authors • Anne K. Driscoll • Yelena Gorina • Jennifer Parker • Kenneth C. Schoendorf Disclosures • No financial disclosures or conflicts of interest Disclaimer • The findings and conclusions in this report are those of the authors and do not necessarily represent the official position of the Centers for Disease Control and Prevention
Background • Life-course model of health suggests that health trajectories are created over time. • The impact of Medicaid may be better considered by examining the percent of children who have Medicaid over the span of their childhood • Rather than the percent enrolled at a particular point in time. • Longitudinal views of Medicaid may allow better understanding of characteristics of the Medicaid population and patterns of enrollment. • Existing national data on Medicaid are Cross-sectional (NHIS) or view over 2 years (MEPS, Current Population Survey).
Background, cont. • Fairbrother, et. al. examined stability of Medicaid coverage across 5 states over 3 years (2000-2003) • 43-66 percent were covered for 2 or more years. • 16-41 percent had gaps, although gaps were often short (2-4 months).
Objectives • Estimate the percentage of children enrolled in Medicaid over 5 years. • Describe sub-populations of the Medicaid enrollee population by years of enrollment: • Enrolled in Medicaid for only a single year of the 5 years • Enrolled in Medicaid for all 5 years. • Compare these groups characteristics by: • Race/ethnicity • Highest level of parental education • Health status • Income-to-poverty ratio.
Methods • We used the 2004 National Health Interview Survey (NHIS) linked to the MAX files (2004-2008) • NHIS is a nationally representative cross-sectional household interview survey. • Health conditions • Utilization • Insurance • Access to health care • Health behaviors • http://www.cdc.gov/nchs/nhis.htm
MAX files • Medicaid Analytic eXtract (MAX) files (2004—2008) • Administrative data for all enrollees in Medicaid and some from the State Children’s Health Insurance Program (CHIP) in all 50 states and the District of Columbia. • M-CHIP data are included in the MAX files under Medicaid • Can be identified as separate from Medicaid • S-CHIP data are sometimes included • Identified as separate from Medicaid • Data is incomplete, even when it does exist
Max Files, cont. • Enrollee’s can be tracked across years (sort of): • Some error here, new MAX Enrollee Master (MAXEM) files for 05-07 are available from CMS for this purpose. • MAX files linked to NHIS likely allow for improved tracking across more years. • Enrollee level information on • Age • Dates of birth/death • Race • Ethnicity • monthly enrollment status • Basis of eligibility • Costs of services during the year • Claims/encounters (for fee-for-service and for some managed care plans) • Payments to managed care plans
Data for each enrollee • Person Summary (PS) file • Demographics, basis of eligibility, months of enrollment, type of insurance plan, summary of other files data • Inpatient Hospitalization (IP) file • Stays, days, ICD-9 dx and procedures, payment • Institutional long-term care file (LT) • Claims records that include facility type, dates of service and discharge status • psychiatric hospitals for the aged • inpatient psychiatric facilities for persons under age 21 • intermediate care facilities for the mentally retarded (ICF/MR), • nursing facilities (NF)
Data for each enrollee • Prescription drugs (RX) file • prescription drugs (national drug codes) • Quantity and day supply • New or refill • Payments • OTC if paid by Medicaid • durable medical equipment provided by pharmacist • Other services (OT) • physician and professional services • outpatient and clinic visits • durable medical equipment • Hospice • home health • lab/x-ray • Payments to managed care
Resources for MAX files • Centers for Medicare & Medicaid Services https://www.cms.gov/medicaiddatasourcesgeninfo/07_maxgeneralinformation.asp • The Research Data Assistance Center (ResDAC) at the University of Minnesota http://www.resdac.org/ • The Henry J. Kaiser Family Foundation http://www.statehealthfacts.org/ http://medicaidbenefits.kff.org/ • National Pharmaceutical Council http://www.npcnow.org/Public/Issues/i_rel_research/Medicaid_Pharmaceutical_Plan_Resources.aspx
Linked years for NHIS MAX file years 1999 2000 2001 2003 2004 2006 2007 2008 2002 2005 1994 1995 1996 1997 1998 1999 2000 2001 2002 2003 2004 2005 National Health Interview Survey years linked
Methods, cont. • Children 0-13 in the 2004 NHIS were identified (person file). • 0-13 chosen so children do not cross 18 year old threshold in last observed year (2008), and because NCHS ERB will not allow following of Medicaid data past the age of 17 for NHIS participants who are minors. • 51.9 % of children 0-13 in the 2004 NHIS were eligible for linkage to the MAX files. • n=10,473 • Person and family characteristics obtained from the 2004 NHIS. • Medicaid enrollment in each year (2004-2008) were obtained from the MAX files.
Methods, cont. • NHIS Sample weights were adjusted to account for linkage ineligibility. • SUDAAN WTADJUST procedure was used to retain appropriate weighting within race/ethnicity, sex, and age group categories. • Analyses conducted and adjusted for complex survey design using STATA 12.1 SE svy suite of commands. • Multiply imputed data for Poverty-to-income ratio provided by the NHIS was accounted for using STATA 12.1 SE mi suite of commands.
Results Percent of all children 0–13 enrolled in Medicaid at any time, over increasing periods of time, 2004–2008
Percent of children 0–13 enrolled in Medicaid at any time, over increasing periods of time, 2004–2008, by race/ethnicity
Percent of children 0–13 enrolled in Medicaid at any time, over increasing periods of time, 2004–2008, by highest level of parental education
Percent of Children enrolled in at any time during 2004-2008 Medicaid by number of years of enrollment • Of children 0–13 years of age in 2004, who were enrolled in Medicaid at any time during 2004–2008, 51.5% (CI: 49.4–53.5%) were on Medicaid during all 5 years (2004–2008).
Reported Health Status • Overall Chi-Square, p<0.001 • Percentage in Excellent/VG health is statistically different between Medicaid enrollment categories, p<0.01 • Percentage in good/fair/poor health is statistically different between Medicaid enrollment categories, p<0.01
Highest level of Parental Education • Overall Chi-square, p<0.001 • High school 1 and 5 year percentages are statistically similar. Some college 0 and 5 year percentages are statistically similar. Otherwise Zero, one, and five year percentages are all statistically different within categories of education, p<0.05.
Race/Ethnicity *not statistically reliable • Overall Chi-Square, p<0.001 • Within race/ethnicity groups (excluding other), all percentages are statistically different across Medicaid enrollment categories, with the exception of no difference between the percentage of beneficiaries that are Hispanic in 1 and 5 years of Medicaid groups. • Within no Medicaid ever group, percentages of NHW, NHB, and H are all statistically different • Within 1 year of Medicaid enrollment, percentages of NHW, NHB, and H are all statistically different • Within 5 years of Medicaid enrollment, NHW, NHB, and H all have statistically similar percentages
Mean Income-to-Poverty Ratio • Income-to-poverty ratio is the ratio of family income to the poverty line for that family • All three values significantly different from one another, p<0.001
Limitations • CHIP enrollment is not included in this analysis, as SCHIP data are incomplete in the MAX data files. • Data from MAX files are 2004-2008 and Medicaid enrollment likely has increased since that time. • Although non-response adjustments have been made, final estimates may be subject to residual bias due to linkage ineligibility for some NHIS respondents.
Conclusions • The percentage of children in 2004 who had Medicaid at any time during the five year period 2004-2008 is approximately 41.0%, approximately 25 percent (or 8percentage points) higher than the estimates of enrollment in a single year (33%). • This percentage is: • 67.4% for non-Hispanic black children • 59.5% for Hispanic children • 78% for children of parents with a highest level of education of less than high school • 59% for children of parents with a high school education. • Of children on Medicaid at any time during a 5 year period, 52% were enrolled in Medicaid during every year of the 5 year period. An additional 13% were enrolled in Medicaid during 4 of the 5 years.
Conclusions, cont. • The characteristics of children in the three groups examined: • those who were never enrolled in Medicaid • those enrolled in Medicaid during one of the five years • those enrolled in Medicaid during all five years • Differed in terms of: • Parental education • Race/ethnicity • Health status • Income-to-poverty ratio
Future projects using Linked Medicaid data • Examine predictors of discontinuing chronic meds • preventive asthma medications (inhaled corticosteroids) • Hospitalization/ED visit rates using different preventive asthma meds within different race/ethnicity and age groups (CER)
Distribution of race/ethnicity among children 0-13 in the US, 2004 (NHIS)
Distribution of highest level of parental education for children 0-13 in the US, 2004 (NHIS)
Distribution of reported health status for children 0-13 in the US, 2004 (NHIS)
Mean family income to poverty ratio for children in the US, 2004 (NHIS)
Percent of children enrolled in Medicaid at any time during 2004–2008, by number of years of enrollment • Of children 0–13 years of age in 2004, who were enrolled in Medicaid at any time during 2004–2008, 51.5% (CI: 49.4–53.5%) were on Medicaid during all 5 years (2004–2008).