Download
1 / 27
270 likes | 408 Views
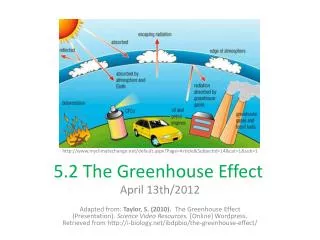
E ffect of surfactants on N 2 O emissions from biologically productive regions. Annette Kock, Jens Schafstall, Tim Fischer, Marcus Dengler, Peter Brandt and Hermann W. Bange. Effects of N 2 O in the atmosphere. N 2 O as greenhouse gas Ozone depletion in the stratosphere.

E N D
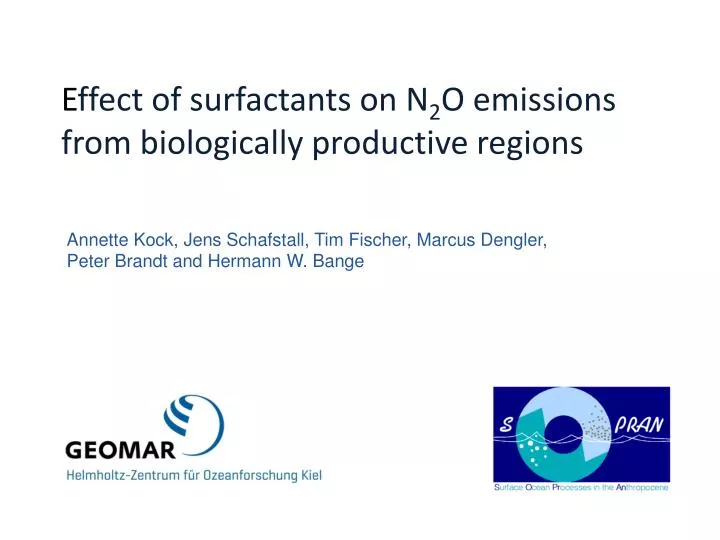
Effect of surfactants on N2O emissions from biologically productive regions Annette Kock, Jens Schafstall, Tim Fischer, Marcus Dengler, Peter Brandt and Hermann W. Bange
Effects of N2O in the atmosphere N2O as greenhouse gas Ozone depletion in the stratosphere Ravishankara et al., 2009: „Nitrous Oxide (N2O): The dominant ozone-depleting substance in the 21st century.“ (Intergovernmental Panel on Climate Change (IPCC), 2007) 320 310 N2O Mole Fraction [ppb] 300 http://agage.eas.gatech.edu/data.htm 1980 1990 2000 2010 Year
Sources of N2O to the atmosphere Denman et al., 2007
N2O in the marine N cycle Oxidation state +V NO3- oxic suboxic/ anoxic NO2- Denitrification Nitrification N2O ±0 N2 NH2OH -III NH4+ Org. N
Global distribution of ΔpN2O -20 0 10 20 30 40 50 60 150 (Suntharalingam & Sarmiento 2000)
N2O distribution off Mauritania N2O [nmol L-1] P347 Jan 07 0 40 50 35 100 30 P348 Feb 07 150 25 200 200 20 400 ATA3 Feb 08 15 600 Depth [m] 10 800 5 1000 21°W 20°W 19°W 18°W 17°W
N2O mixed layer budget in the Mauritanian upwelling Atmosphere Gas exchange Mixed layer N2O production Pycnocline Continent Vertical advection Diapycnal flux Subsurface ocean
N2O fluxes off Mauritania • Diapycnal flux calculated by microstructure measurements of small scale turbulence in combination with N2O-profiles from the water column. • Quantification of sea-to-air flux from surface N2O concentrations and in-situ wind speeds. 0 ΔN2O [nmol L-1] 12 50 21°N 10 20°N 100 8 Depth [m] 19°N 150 6 18°N 4 200 17°N 2 18°W 17°W 16.8°W 16.6°W 16.5°W 16.4°W 16.3°W 16°N 0 24°W 22°W 16°W 1e-006 1e-005 0.0001 0.001 0.01 20°W 18°W Kρ [m2 s-1]
Comparison of sea-to-air and diapycnal flux Projection of all Stations to 18°N Diapycnal flux Sea-to-air flux 0 Water depth [m] 2000 4000 24°W 22°W 20°W 18°W 16°W
N2O mixed layer budget in the Mauritanian uwpelling Atmosphere Sea-to-air flux -0.069 nmol m-2 s-1 Potential N2O production rate in the mixed layer Flux difference Mixed Layer N2O production 25m +0.048 nmol m-2 s-1 ~60 nmol L-1 yr-1 Pycnocline Continent Vertical advection Diapycnal flux +0.019 nmol m-2 s-1 +0.002 nmol m-2 s-1 Subsurface ocean
N2O Production in the mixed layer? Potential N2O production rate: ~60 nmol L-1 yr-1 PRO CONTRA • Evidence for nitrification in the euphotic zone -> N2O production in the mixed layer (e.g. Yool et al. 2007, Clark et al. 2008). • Previous mixed layer budget calculations for N2O indicate strong near-surface production (e.g. Dore & Karl, 1996; Morell et al., 2001) • N2O production rate below the mixed layer: <3.3 nmol L-1 yr -1(Freing et al., 2012). • N2O yield increases with decreasing oxygen concentrations (Goreau et al., 1980; Löscher et al., 2012). • Measurements of nitrification rates in the Mauritanian upwelling: higher nitrification rates at greater depths than in the surface (Rees et al., 2011). • Surface N2O distribution linked to upwelling
Effect of surfactants on N2O gas exchange in laboratory studies K. Richter, p.c., see poster „The Schmidt Number Dependency of Air-Sea Gas Exchange with Varying Surfactant Coverage” 20 20 x3 x3 x3 20
Effect of surfactants on N2O gas exchange in the field? • Good conditions for occurrence of surfactants in upwelling areas (Wurl et al., 2011; Gasparovic et al., 1998 ). Recalculation of sea-to-air flux using gas exchange parameterization of Tsai & Liu (2003). Nightingale et al. 2000 Tsai & Liu 2003, surfactant-influenced Similar findings: Calculations of net community production based on CO2/N2O O2/N2O (Steinhoff et al., 2012; see poster „Biological productivity in the Mauritanian upwelling estimated with a triple gas approach”)
N2O mixed layer budget with reduced gas exchange Atmosphere Sea-to-air flux (Parameterization Tsai & Liu 2003) -0.020 nmol m-2 s-1 Flux difference Mixed layer N2O production -0.001 nmol m-2 s-1 Pycnocline Continent Vertical advection Diapycnal flux +0.019 nmol m-2 s-1 +0.002 nmol m-2 s-1 Subsurface ocean
temperature diurnal cycle 0°N 10°W Diurnal stratification in the equatorial Atlantic 0 Intense solar irradiation: → Evolution of a diurnal stratification within the mixed layer → Supersaturated N2O concentrations in the deeper mixed layer cut off from the sea-surface while near-surface waters may quickly equilibrate. 5 Depth [m] 10 20:00 5:00 10:00 15:00 0:00 Time Glider measurements of temperature during MSM 18-2 & MSM 18-3, equatorial Atlantic, May-July 2011
Consequences? Favorable conditions for surfactants: Areas with high primary productivity, high solar irradiation, low to moderate wind speeds. → Most eastern boundary upwelling systems, equatorial upwelling, coastal areas. data from Denman et al., 2007
Summary & Conclusions • Mixed layer budget off Mauritania reveals large discrepancy between sea-to-air flux and supply from subsurface layer. • Mixed layer source of N2O would require extremely high production rates to compensate discrepancy. • Reduced gas exchange in line with findings by Steinhoff et al., 2012 and K. Richter. • Potential for reduced N2O emissions from other upwelling areas, too. • Effect of surfactants on N2O emissions from other productive regions needs to be investigated. • Other possible causes for budget imbalance need to be considered! • Poster: „Physical processes controlling greenhouse gas emission in upwelling regions of the ocean: a N2O case study”
Future activities • R/V Meteor Cruise 91 (Peruvian upwelling), December 2012: • Evaluate potential processes that influence the mixed layer budget of N2O: • High resolution N2O profiles of mixed layer • Microstructure measurements • High resolution underway pCO2/pN2O • Determination of the role of the organic matter • and gel particles in the surface microlayer for • the air-sea gas exchange of trace gases. • Air-sea gas echange processes and atmos. fluxes • Determination of the upwelling velocity
Advances in measurement techniques Better precision of underway measurements using OA-ICOS N2O analyzer allows flux calculation even at low ΔN2O MSM 18-2, equatorial Atlantic May/June 2011 Arevalo, 2012
Effect of surfactants on N2O gas exchange – laboratory results Kerstin Richter, p.c.
N2O in the marine N cycle Oxidation state +V NO3- • Nitrification • Bacterial and archaeal ammonium oxidation • N2O production during archaeal nitrification (Santoro et al. 2011, Löscher et al. 2012) • N2O production increases with decreasing oxygen (Goreau et al. 1980, Löscher et al., 2012) • Light inhibition of nitrification (e.g. Guerrero & Jones, 1996) challenged by in-situ measurements of nitrification rates (e.g. Clark et al. 2008) oxic suboxic/ anoxic NO2- Denitrification Nitrification N2O ±0 N2 NH2OH -III NH4+ Org. N