Download
1 / 22
220 likes | 357 Views
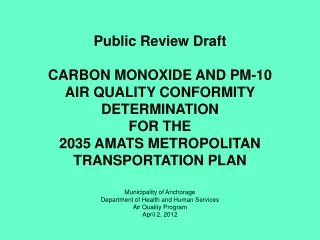
Public Review Draft CARBON MONOXIDE AND PM-10 AIR QUALITY CONFORMITY DETERMINATION FOR THE 2035 AMATS METROPOLITAN TRANSPORTATION PLAN. Municipality of Anchorage Department of Health and Human Services Air Quality Program April 2, 2012.

E N D
Public Review DraftCARBON MONOXIDE AND PM-10AIR QUALITY CONFORMITY DETERMINATIONFOR THE 2035 AMATS METROPOLITAN TRANSPORTATION PLAN Municipality of Anchorage Department of Health and Human Services Air Quality Program April 2, 2012
I get the feeling that there may be more exciting ways to spend my lunch hour. What is conformity? • AMATS must make an affirmative determination that the MTP is consistent with Alaska State Air Quality Control Plan (SIP) and does not interfere with the attainment or maintenance of air quality standards. • FHWA must concur. • Federal regulations (40 CFR 93) prescribe how this is to be done.
AMATS Planning Area includes the CO Maintenance Area in the Anchorage bowl and the Eagle River PM-10 Nonattainment Area in “urban” Eagle River.
Carbon monoxide (CO) Colorless odorless gas produced by incomplete combustion NAAQS = 9 ppm for 8-hour average 79% from motor vehicle emissions, a large portion of which is generated during “cold starts.” Highest concentrations on cold, calm winter days during strong temperature inversions. Residential areas where warm-up idling is prevalent have highest concentrations. PM-10 Airborne particulate less than 10 microns in diameter NAAQS = 150 μg/m3 for 24-hour average 90% or more from geological sources Paved and unpaved road dust Natural wind blown silt from glacial river valleys in Mat Su Highest concentrations during spring break-up and fall freeze-up. Highest concentrations near major paved roadways or unpaved roads.
Trend in 2nd Maximum 8-hour CO Concentration at Anchorage CO Monitoring Stations 1980 - 2010
Motor Vehicle CO Emission Budget • 156.5 tons per day • theoretical” estimate of how much CO can be emitted by motor vehicles in the inventory area without violating the NAAQS • based on measured CO air quality and computer model estimates of emissions in base year 2007 • set out in the Anchorage CO Maintenance Plan (SIP) and approved by the EPA
I can’t wait to see how this turns out.... CO Emissions Forecast for MTP Emissions in 2015, 2025, and 2035 depend on how much growth there will be in motor vehicle travel and how much CO each vehicle will be emitting. Will improved emission control technology offset the growth in vehicle travel?
AMATS Transportation Model provides projections of motor vehicle travel activity for 2015, 2025 and 2035 • Uses modified ISER regional population and employment projections in combination with guidance from the MOA Comprehensive Plan to determine where people will live and work and are therefore likely to travel. • Propensity to travel is based on household income. More trips are generated in high income areas. • “Overlays” the transportation network envisioned in the MTP for analysis years 2015, 2025 and 2035. • Model “thinks” like a pipe network. The amount of flow = amount of traffic • People avoid “pipes” that are congested and do not necessarily take the shortest route between here and there. • MTP adds or enlarges “pipes,” and provides transportation alternatives (transit, vanpool, carpool, bicycle, pedestrian) to help relieve congestion. Regional ISER projections weremodified to fit AMATS boundaries
Congestion identified in 2035 “No build” scenario The transportation model is used to identify roadway links that are likely to be congested in the future.
Summary Inputs and Outputs AMATS Transportation Model
The EPA MOVES (Motor Vehicle Emission Simulation) Model is used to estimate motor vehicle CO emission rates under Anchorage-specific conditions: • Weekday in January, ambient temperature = 4 ºF • Anchorage vehicle type and age distribution • Local gasoline and diesel specifications • Anchorage distribution of gasoline vs. diesel vs. alternative fuel vehicles
Sample computation of CO emissions in one grid for AM period (7 am – 9 am) for analysis year 2035
MOVES summary results Note that the starting emission rate increases by 4% between 2007 and 2035 while the running emission rate drops by 40%.
MOVES emission rates are multiplied by transportation model estimates of travel activity to compute total CO emissions • Starting emissions = starting emission rate x number of starts 124.5 grams/start x 840,989 starts = 104,703,130 grams = 115.3 tons per day • Running emissions = running emission rate x vehicle miles traveled 6.4 grams/mile x 4,316,888 miles = 27,628,083 grams = 30.3 tons per day • Extended idle emissions (long haul trucks) = 0.3 tons per day TOTAL MOTOR VEHICLE EMISSIONS = 145.8 tons per day Compute emissions in analysis year 2035:
The AMATS MTP is under budget throughout the 2012 – 2035 planning horizon despite the apparent starting emission rate anomaly.
I hope this is even more exciting than the CO stuff. PM-10 conformity
No violations of the NAAQS since 1987 Gravel roads were paved or surfaced with recycled asphalt PM-10 “Limited Maintenance Plan” submitted to EPA in 2010 (still under review) EPA has approved use of simplified LMP process for this conformity determination Federal Register notice expected in late April.
Trend in Eagle River PM-10 Concentrations DV has been below 98 μg/m3 since 2006. Thus, Eagle River qualifies for LMP option.
PM-10 conformity under LMP option • No emission budget test necessary because limited maintenance areas determined to have low probability of violating the NAAQS even with anticipated growth in motor vehicle travel. • LMP conformity requires: • Affirm annual DV below 98 μg/m3√ • Timely implementation of transportation control measures (TCMs) √ • MTP cannot interfere with TCMs √
Interagency consultation40 CFR 93.105 & 93.112 • Requires federal, state and local agencies to review and consult • Teleconferences held with FHWA, EPA, FTA, ADEC, ADOT&PF, AMATS and MOA • Minor edits made as a consequence of comments from FHWA and EPA are reflected in public review draft. • Consultation participants gave “go ahead” to proceed with public review draft during consultation on March 6.
I think staff would like to see a recommendation from you before the public comment period ends on April 9. AMATS Air Quality Advisory Committee Recommendation