Download
1 / 50
610 likes | 1.19k Views
Organic Chemistry , 6 th Edition L. G. Wade, Jr. Chapter 12 Mass Spectrometry and Infrared Spectroscopy . Jo Blackburn Richland College, Dallas, TX Dallas County Community College District ã 2006, Prentice Hall. Mass Spectrometry.

E N D
Organic Chemistry, 6th EditionL. G. Wade, Jr. Chapter 12 Mass Spectrometry and Infrared Spectroscopy Jo Blackburn Richland College, Dallas, TX Dallas County Community College District ã 2006,Prentice Hall
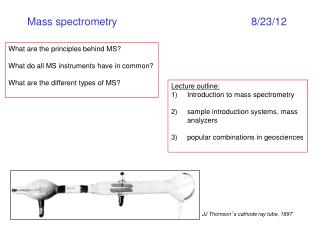
Mass Spectrometry • Molecular weight can be obtained from a very small sample. • It does not involve the absorption or emission of light. • A beam of high-energy electrons breaks the molecule apart. • The masses of the fragments and their relative abundance reveal information about the structure of the molecule. => Chapter 12
=> Electron Impact Ionization A high-energy electron can dislodge an electron from a bond, creating a radical cation (a positive ion with an unpaired e-). Chapter 12
Separation of Ions • Only the cations are deflected by the magnetic field. • Amount of deflection depends on m/z. • The detector signal is proportional to the number of ions hitting it. • By varying the magnetic field, ions of all masses are collected and counted. => Chapter 12
Mass Spectrometer => Chapter 12
The Mass Spectrum Masses are graphed or tabulated according to their relative abundance. => Chapter 12
The GC-MS A mixture of compounds is separated by gas chromatography, then identified by mass spectrometry. => Chapter 12
Molecules with Heteroatoms • Isotopes: present in their usual abundance. • Hydrocarbons contain 1.1% C-13, so there will be a small M+1 peak. • If Br is present, M+2 is equal to M+. • If Cl is present, M+2 is one-third of M+. • If iodine is present, peak at 127, large gap. • If N is present, M+ will be an odd number. • If S is present, M+2 will be 4% of M+. => Chapter 12
Calculating Molecular Formula from MS Data • Using M+ and M+1 data calculate the number of carbon atoms in the molecule • # of Carbons = ((M+1/M+)/1.1)X100 (intensity values) • ID the presence of S, Cl or Br by M+2 data • ID the presence of N using M+ value Chapter 12
Isotopic Abundance => Chapter 12
Mass Spectrum with Sulfur => Chapter 12
Mass Spectrum with Chlorine => Chapter 12
Mass Spectrum with Bromine => Chapter 12
Introduction • Spectroscopy is an analytical technique which helps determine structure. • It destroys little or no sample. • The amount of light absorbed by the sample is measured as wavelength is varied. => Chapter 12
Types of Spectroscopy • Infrared (IR) spectroscopy measures the bond vibration frequencies in a molecule and is used to determine the functional group. • Mass spectrometry (MS) fragments the molecule and measures the masses. • Nuclear magnetic resonance (NMR) spectroscopy detects signals from hydrogen atoms and can be used to distinguish isomers. • Ultraviolet (UV) spectroscopy uses electron transitions to determine bonding patterns. => Chapter 12
Electromagnetic Spectrum • Examples: X rays, microwaves, radio waves, visible light, IR, and UV. • Frequency and wavelength are inversely proportional. • c = ln, where c is the speed of light. • Energy per photon = hn, where h is Planck’s constant, 6.62 x 10-37 kJ•sec. => Chapter 12
The Spectrum and Molecular Effects => Chapter 12
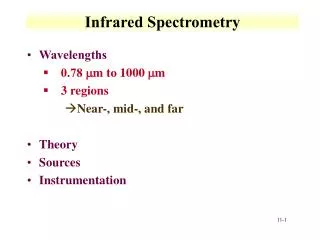
The IR Region • Just below red in the visible region. • Wavelengths usually 2.5-25 mm. • More common units are wavenumbers, or cm-1, the reciprocal of the wavelength in centimeters. • Wavenumbers are proportional to frequency and energy. => Chapter 12
Molecular Vibrations Covalent bonds vibrate at only certain allowable frequencies. => Chapter 12
Stretching Frequencies • Frequency decreases with increasing atomic mass. • Frequency increases with increasing bond energy. => Chapter 12
Vibrational Modes Nonlinear molecule with n atoms usually has 3n - 6 fundamental vibrational modes. Chapter 12
Fingerprint of Molecule • Whole-molecule vibrations and bending vibrations are also quantized. • No two molecules will give exactly the same IR spectrum (except enantiomers). • Simple stretching: 1600-3500 cm-1. • Complex vibrations: 600-1400 cm-1, called the “fingerprint region.”=> Chapter 12
=> IR-Active and Inactive • A polar bond is usually IR-active. • A nonpolar bond in a symmetrical molecule will absorb weakly or not at all. Chapter 12
An Infrared Spectrometer => Chapter 12
FT-IR Spectrometer • Has better sensitivity. • Less energy is needed from source. • Completes a scan in 1-2 seconds. • Takes several scans and averages them. • Has a laser beam that keeps the instrument accurately calibrated. => Chapter 12
FT-IR Interferometer => Chapter 12
=> Interferogram The interferogram at the right displays the interference pattern and contains all of the spectrum information. A Fourier transform converts the time domain to the frequency domain with absorption as a function of frequency. Chapter 12
Carbon-Carbon Bond Stretching • Stronger bonds absorb at higher frequencies: • C-C 1200 cm-1 • C=C 1660 cm-1 • CC <2200 cm-1 (weak or absent if internal) • Conjugation lowers the frequency: • isolated C=C 1640-1680 cm-1 • conjugated C=C 1620-1640 cm-1 • aromatic C=C approx. 1600 cm-1 => Chapter 12
Carbon-Hydrogen Stretching Bonds with more s character absorb at a higher frequency. • sp3 C-H, just below 3000 cm-1 (to the right) • sp2 C-H, just above 3000 cm-1 (to the left) • sp C-H, at 3300 cm-1 => Chapter 12
An Alkane IR Spectrum => Chapter 12
An Alkene IR Spectrum => Chapter 12
An Alkyne IR Spectrum => Chapter 12
O-H and N-H Stretching • Both of these occur around 3300 cm-1, but they look different. • Alcohol O-H, broad with rounded tip. • Secondary amine (R2NH), broad with one sharp spike. • Primary amine (RNH2), broad with two sharp spikes. • No signal for a tertiary amine (R3N). => Chapter 12
An Alcohol IR Spectrum => Chapter 12
An Amine IR Spectrum => Chapter 12
Carbonyl Stretching • The C=O bond of simple ketones, aldehydes, and carboxylic acids absorb around 1710 cm-1. • Usually, it’s the strongest IR signal. • Carboxylic acids will have O-H also. • Aldehydes have two C-H signals around 2700 and 2800 cm-1. => Chapter 12
A Ketone IR Spectrum => Chapter 12
An Aldehyde IR Spectrum => Chapter 12
O-H Stretch of a Carboxylic Acid This O-H absorbs broadly, 2500-3500 cm-1, due to strong hydrogen bonding. => Chapter 12
Variations in C=O Absorption • Conjugation of C=O with C=C lowers the stretching frequency to ~1680 cm-1. • The C=O group of an amide absorbs at an even lower frequency, 1640-1680 cm-1. • The C=O of an ester absorbs at a higher frequency, ~1730-1740 cm-1. • Carbonyl groups in small rings (5 C’s or less) absorb at an even higher frequency. => Chapter 12
An Amide IR Spectrum => Chapter 12
Carbon - Nitrogen Stretching • C - N absorbs around 1200 cm-1. • C = N absorbs around 1660 cm-1 and is much stronger than the C = C absorption in the same region. • C N absorbs strongly just above 2200 cm-1. The alkyne C C signal is much weaker and is just below 2200 cm-1 .=> Chapter 12
A Nitrile IR Spectrum => Chapter 12
Summary of IR Absorptions => Chapter 12
Strengths and Limitations • IR alone cannot determine a structure. • Some signals may be ambiguous. • The functional group is usually indicated. • The absence of a signal is definite proof that the functional group is absent. • Correspondence with a known sample’s IR spectrum confirms the identity of the compound. => Chapter 12
Elucidation of the FTIR Spectrum • Inspect the 3000cm-1 region for unsaturations • Inspect the 3200-3500cm-1 region for alcohols/carboxylic acids • Inspect the 1600-1700cm-1 region for carbonyl (C=O) functional groups • Inspect the 1100-1300cm-1 region for C–O signal – possible ether, ester… Chapter 12
FTIR Examples The IR spectrum shown corresponds to which compound? No –OH, –NH or –CO2H Most significant peak in the spectrum of C=O <3000 therefore no unsaturated C-H’s Chapter 12
The IR spectrum shown corresponds to which compound? O-H stretch No C=O C-O signal Saturated and unsaturated C-H’s Chapter 12
The IR spectrum shown corresponds to which compound? Inconclusive however, no O-H, possibly N-H or –CO2H Definitely a C=O!! Chapter 12
End of Chapter 12 Chapter 12