Download
1 / 32
340 likes | 555 Views
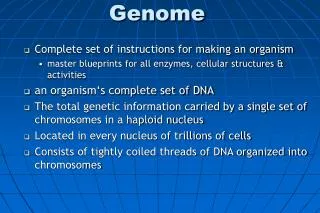
Genome Mapping cattle swine sheep horse dog chicken cat turkey human mouse. Development of a Genome Map goal - identify locations of genes on chromosomes reason manipulate genes of interest to enhance performance identify animals with specific genes. Development of a Genome Map

E N D
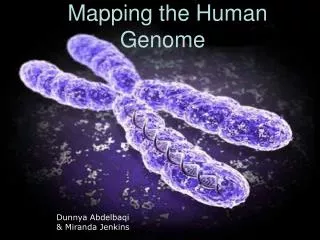
Genome Mapping • cattle swine • sheep horse • dog chicken • cat turkey • human mouse
Development of a Genome Map goal - identify locations of genes on chromosomes reason manipulate genes of interest to enhance performance identify animals with specific genes
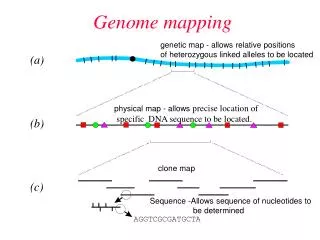
Development of a Genome Map Genes on the same chromosome exhibit linkage Gene mapping determines the order of genes and the relative distances between them in map units 1 map unit=1 cM (centimorgan)
Development of a Genome Map recombination frequencies used to determine the relative distances between loci Distance measurement: 1 map unit = 1 percent recombination
Development of a Genome Map recombination frequencies less than 50 loci on the same chromosome recombination frequency greater than 50 loci on different chromosomes or far apart on the same chromosome
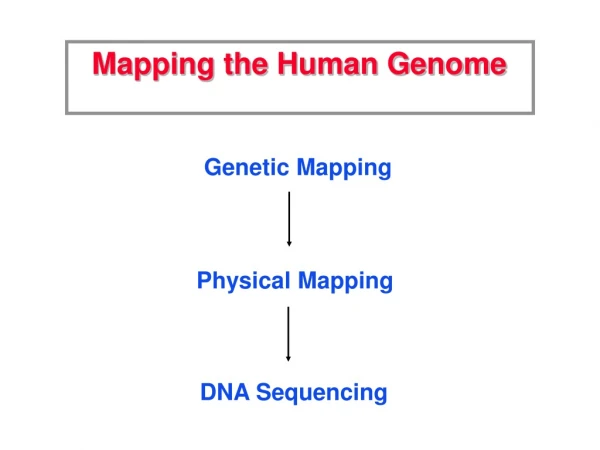
Development of a Genome Map Map distances not a direct measurement of physical distance physical maps (cytogenetic) where are the genes on chromosomes linkage maps how are the genes organized
Development of a Genome Map restriction enzymes cut DNA whenever certain base sequences occur use of restriction enzymes will produce different fragments different alleles will produce different fragment patterns
Development of a Genome Map polymorphism common genetic difference in a population must have differences to locate segments RFLP - restriction fragment length polymorphism
RFLP From Hartl and Jones
RFLP From Hartl and Jones
Development of a Genome Map RFLP if restriction sites differ the lengths of the fragments will differ fragments of different lengths will migrate different distances in a gel
Development of a Genome Map simple tandem repeat polymorphism TGTGTGTGTGTGTGTG genome is interspersed with segments like this (called microsatellites) much polymorphism in length of microsatellites
Fragments of different length From Hartl and Jones
Development of a Genome Map RFLPs, microsatellites etc. can be used to identify markers Marker - segment of recognizable DNA marker does not necessarily code for something functional
Development of a Genome Map building a map identify several markers determine which are linked start establishing linkage maps can start assigning to chromosomes physical or cytogenetic maps can be built
Development of a Genome Map marker maps do not address function once each chromosome has several markers identified can start assigning functional genes to locations relative to the markers
Development of a Genome Map comparative map similarity in evolutionary background should lead to similarity in maps called “conservation” can use genomic similarities to assist mapping of various organisms
Cattle Gene Maps Cattle Map - at Texas A&M Univ. Cattle Map - at UIUC Cattle Map - at MARC, USDA Cattle Map - at USDA Cattle Map - at Roslin Inst., UK Cattle Map - at France Cattle Map - at Australia Cattle Map - at Japan
Pig Gene Maps Pig Map - at Iowa State Univ. Pig Map - at USDA-MARC Pig Map - at USDA Pig Map - at Roslin Inst., UK Pig Map - at France Pig Map - at Japan
Chicken Gene Maps Chicken Map - at Iowa State Univ. Chicken Map - at Michgan State Univ. Chicken Map - at Roslin Inst., UK Chicken Map - at USDA Chicken Map - at Wageningen Agri. Univ.
Sheep Gene Maps Sheep Map - at USDA-MARC Sheep Map - at USDA Sheep Map - at Molboune, AU Sheep Map - at New Zealand Sheep Map - at Roslin Inst., UK Sheep Map - at Japan
Horse Genetics Horse Genetics, UC-Davis Horse Map - at Roslin Inst., UK Horse Map - at INRA, France Horse Map - at Japan
Turkey Genetics Turkey Map - Roslin., UK Goat Gene Map Goat Map - INRA, France Rainbow Trout Genome Project Rainbow Trout Genome, INRA, France Rabbit Genome Project Rabbit Genome, INRA, France
Cat Genome, Roslin Inst., UK Dog Genome, UC-Berkerley Dog Genome, Univ. of Berne, Switzerland Fly Genetics: Harvard Fly Genetics: Indiana Mouse Map - at Jackson Lab Mouse and Rat Genetics, USA Mouse Map at Japan
NATIONAL RESEARCH SUPPORT PROJECT PROPOSAL PROJECT NUMBER: NRSP-8 TITLE: National Animal Genome Research Program (NAGRP) DURATION: October 1, 1998 - September 30, 2003
OBJECTIVES OF NRSP-8 1. Develop high resolution comparative genome maps aligned across species that link agricultural animal maps to those of the human and mouse genomes. 2. Increase the marker density of existing linkage maps used in QTL mapping and integrate them with physical maps of animal chromosomes. 3. Expand and enhance internationally shared species genome databases and provide other common resources that facilitate genome mapping.
EXPECTED OUTCOMES: 1. genome maps for agricultural species will be improved to a resolution of 1-2 cM from the existing 5-10 cM. 2. Physical maps will be developed that cover large contiguous chromosomal domains or whole chromosomes. 3. Comparative maps which link the genomes of agricultural animals to those of human and mouse. 4. Together, the first three outcomes will facilitate the isolation and characterization of ETL-encoding genes from several species.
EXPECTED OUTCOMES: 5. New genetic tests will be developed for productivity and disease resistance traits. 6. Internationally-shared species genome databases will be enhanced 7. Marker primer pairs, DNA mapping panels, large insert libraries and other relevant mapping resources will be obtained by participating laboratories at little or no cost.