Download
1 / 1
10 likes | 20 Views
Team Dork Matter. Physics of Atomic Nuclei Program – August 2009: Studying Subatomic Particles using MoNA at the NSCL. Kevin. John. µ. Nicole. PAN At the National Superconducting Cyclotron Laboratory: Using the Modular Neutron Array ( M o NA ).

E N D
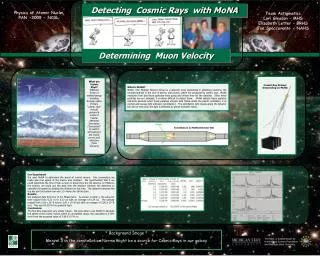
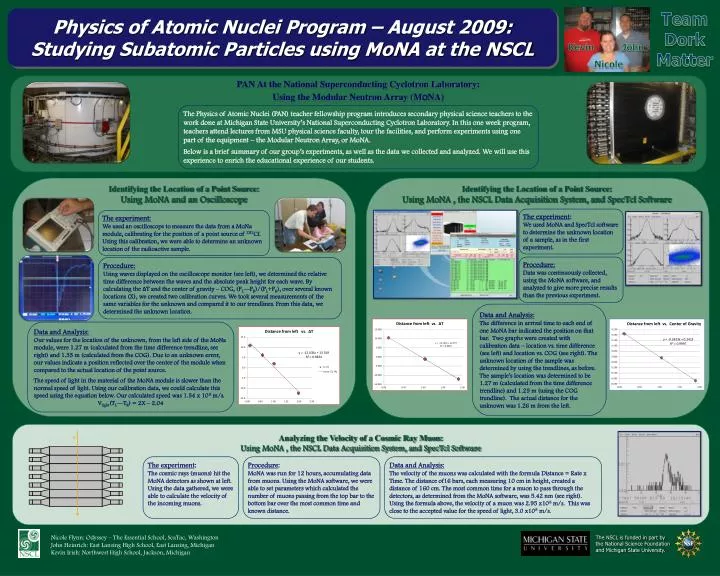
Team Dork Matter Physics of Atomic Nuclei Program – August 2009:Studying Subatomic Particles using MoNA at the NSCL Kevin John µ Nicole PAN At the National Superconducting Cyclotron Laboratory: Using the Modular Neutron Array (MoNA) The Physics of Atomic Nuclei (PAN) teacher fellowship program introduces secondary physical science teachers to the work done at Michigan State University’s National Superconducting Cyclotron Laboratory. In this one week program, teachers attend lectures from MSU physical science faculty, tour the facilities, and perform experiments using one part of the equipment – the Modular Neutron Array, or MoNA. Below is a brief summary of our group’s experiments, as well as the data we collected and analyzed. We will use this experience to enrich the educational experience of our students. Identifying the Location of a Point Source: Using MoNA and an Oscilloscope Identifying the Location of a Point Source: Using MoNA , the NSCL Data Acquisition System, and SpecTcl Software The experiment: We used MoNA and SpecTcl software to determine the unknown location of a sample, as in the first experiment. The experiment: We used an oscilloscope to measure the data from a MoNa module, calibrating for the position of a point source of 252Cf. Using this calibration, we were able to determine an unknown location of the radioactive sample. Procedure: Data was continuously collected, using the MoNA software, and analyzed to give more precise results than the previous experiment. Procedure: Using waves displayed on the oscilloscope monitor (see left), we determined the relative time difference between the waves and the absolute peak height for each wave. By calculating the ∆T and the center of gravity – COG, (PL—PR)/(PL+PR), over several known locations (X), we created two calibration curves. We took several measurements of the same variables for the unknown and compared it to our trendlines. From this data, we determined the unknown location. Data and Analysis: The difference in arrival time to each end of one MoNA bar indicated the position on that bar. Two graphs were created with calibration data – location vs. time difference (see left) and location vs. COG (see right). The unknown location of the sample was determined by using the trendlines, as before. The sample’s location was determined to be 1.27 m (calculated from the time difference trendline) and 1.25 m (using the COG trendline). The actual distance for the unknown was 1.26 m from the left. Data and Analysis: Our values for the location of the unknown, from the left side of the MoNa module, were 1.27 m (calculated from the time difference trendline, see right) and 1.33 m (calculated from the COG). Due to an unknown error, our values indicate a position reflected over the center of the module when compared to the actual location of the point source. The speed of light in the material of the MoNA module is slower than the normal speed of light. Using our calibration data, we could calculate this speed using the equation below. Our calculated speed was 1.54 x 10⁸ m/s. Vlight(TL—TR) = 2X – 2.04 Analyzing the Velocity of a Cosmic Ray Muon: Using MoNA , the NSCL Data Acquisition System, and SpecTcl Software The experiment: The cosmic rays (muons) hit the MoNA detectors as shown at left. Using the data gathered, we were able to calculate the velocity of the incoming muons. Procedure: MoNA was run for 12 hours, accumulating data from muons. Using the MoNA software, we were able to set parameters which calculated the number of muons passing from the top bar to the bottom bar over the most common time and known distance. Data and Analysis: The velocity of the muons was calculated with the formula Distance = Rate x Time. The distance of16 bars, each measuring 10 cm in height, created a distance of 160 cm. The most common time for a muon to pass through the detectors, as determined from the MoNA software, was 5.42 nm (see right). Using the formula above, the velocity of a muon was 2.95 x10⁸ m/s. This was close to the accepted value for the speed of light, 3.0 x10⁸ m/s. Nicole Flynn: Odyssey – The Essential School, SeaTac, Washington John Heinrich: East Lansing High School, East Lansing, Michigan Kevin Irish: Northwest High School, Jackson, Michigan