Download
1 / 21
210 likes | 276 Views
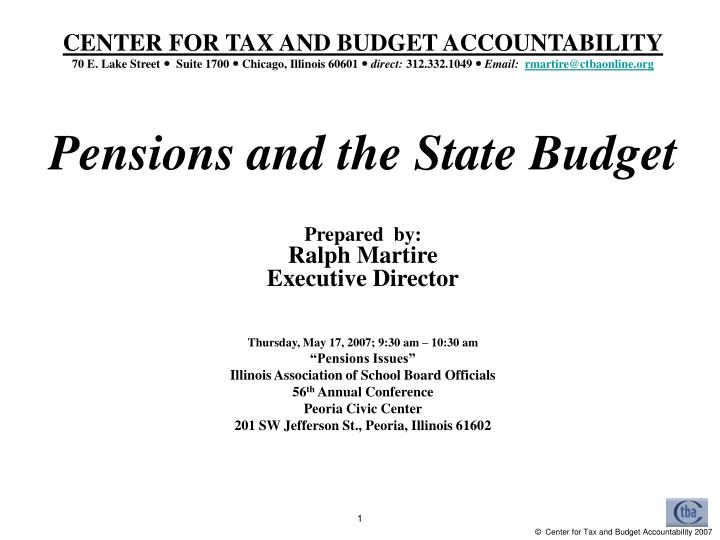
CENTER FOR TAX AND BUDGET ACCOUNTABILITY 70 E. Lake Street Suite 1700 Chicago, Illinois 60601 direct: 312.332.1049 Email: rmartire@ctbaonline.org Pensions and the State Budget Prepared by: Ralph Martire Executive Director Thursday, May 17, 2007; 9:30 am – 10:30 am

E N D
CENTER FOR TAX AND BUDGET ACCOUNTABILITY70 E. Lake Street Suite 1700 Chicago, Illinois 60601 direct: 312.332.1049 Email: rmartire@ctbaonline.orgPensions and the State Budget Prepared by:Ralph MartireExecutive DirectorThursday, May 17, 2007; 9:30 am – 10:30 am “Pensions Issues” Illinois Association of School Board Officials 56th Annual Conference Peoria Civic Center 201 SW Jefferson St., Peoria, Illinois 61602 1
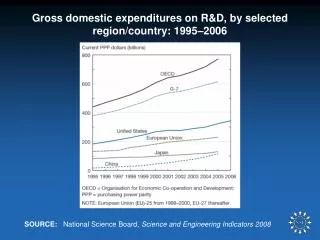
GRF Expenditures by Category, 1995 - 2006 **Notes: Health care includes Medicaid and state employee health insurance Sources: State of Illinois' Traditional Budgetary Financial Reports and Fiscal Focus Illinois' FY2006 Budget National Association of State Budget Officers Comptroller Fiscal Focus, January 1997 CPI and ECI based on Bureau of Labor Statistics 3
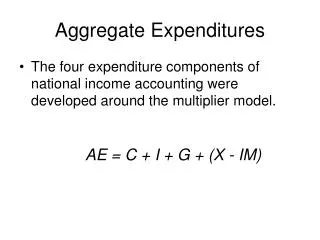
Figure 3: 2004 Funded Ratio and Share of Debt of the Five Illinois Retirement Systems[1] [1] Ibid – FY 2004 numbers reported by the Illinois Commission on Government Forecasting and Accountability adjusted to cover the impact of the Pension Holiday taken for Fiscal Years 2006 and 2007, under P.A. 94-0004. 5
Comparable State & Local Government Annual Retirement Benefits 7
Average State & Local Government Employment Annual Retirement Benefits 8
FY07 Normal Costs of the Five Illinois Retirement Systems 10
Defined Contribution Myths • Because of Illinois constitutional restraints, switching to a defined contribution system does not and cannot reduce the state's current $40.7 billion unfunded liability. The sole way to cover this liability is to design a rational program that does not back load costs like current law. • Defined contribution systems have significantly higher annual administrative costs than fully funded defined benefit systems. If Illinois moved to a defined contribution system for all current participants in the five Illinois state pension systems, that change would cost taxpayers from $275 million to $610 million per year in additional administrative costs. • If contribution rates remained the same, defined contribution systems can be expected to generate significantly lower retirement benefits. For example, when Nebraska switched to a defined contribution system, the average benefit was only $11,230 per year compared to $16,797 per year under the defined benefit system. 13
Defined Contribution Myths • Defined contribution systems have the advantage of creating fiscal discipline that is absent from a defined benefit system. Due to their construction, defined contribution systems would force the state to make the required employer contribution into the employees account on a per pay period basis, rather than offering promises of future benefits, as under the current defined benefit system. • From an employee's perspective, a defined contribution system would have two advantages over a defined benefit system: (i) the benefits would be portable from job to job; and (ii) an employee could access his or her defined contribution account for emergencies pre-retirement (although subject to tax penalties, in certain situations). • The three main disadvantages of a defined contribution system are: (i) reduced and uncertain retirement benefits; (ii) lesser investment returns; and (iii) market risks. • On balance, when funded in a fiscally responsible manner, a defined benefit system permits the public sector to provide its workers with better retirement benefits at lower overall cost to taxpayers. 14
The Illinois Structural Deficit (How Revenue Growth will not Keep Pace with the Cost of Current Services) 15
Growth in State Issued Revenue and General Obligation Bond Debt: 2000-2006 $25.000 $22.820 $22.241 $21.809 $20.812 $20.000 $15.000 $9.543 $10.000 $8.444 $7.684 $5.000 $0.000 2000 2001 2001 2003 2004 2005 2006 16
Since 2000, the percentage of general fund revenues going to pay off debt has risen from under 4% to over 7% of total revenues. That means almost $2 billion of all general funds WENT to paying off debt and interest in the last, complete Fiscal Year (2006) instead of going to fund public services. 17
General Obligation and State-Issued Revenue Debt as a Percentage of General Fund Revenues 8% 7.08% 7% 6.40% 6.06% 6% 4.73% 5% 4.42% 4.02% 3.83% 4% 3% 2% 1% 0% 2000 2001 2002 2003 2004 2005 2006 18
Debt Comparisons: Illinois v. Other States • Illinois has more total debt than only two other states, California and New York. • In 2004, Moody’s reported Illinois owned 7.5% of the total national debt. • The National Association of State Budget Officers report that when per capita debt is more than $1,200, as is Illinois, it becomes unmanageable for the state. • Illinois has more than double debt per capita than the national average. 19
Tax-Supported Debt Per Capita: Illinois Ranks 6th Nationally in Debt Per Capita which is More Than Double the National Average $2,500 $2,019 $2,000 $1,500 $999 $1,000 $500 $0 Illinois National Average 20
Illinois also ranks high nationally when comparing tax-supported debt as a percentage of personal income. Again, the state has almost double the national average. • Moody’s rates Illinois lower than 30 states in its credit rating. Thirteen states rank similar to Illinois and three are given credit ratings lower than Illinois. 21