Download
1 / 54
540 likes | 641 Views
Pedigree Analysis Theory and Application. David Jordan Principal Sorghum Breeder Queensland Department of Primary Industries and Fisheries. Objectives. Drivers The declining cost of generating molecular marker data The increasing costs of generating phenotypic data

E N D
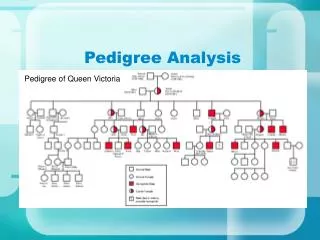
Pedigree Analysis Theory and Application David Jordan Principal Sorghum Breeder Queensland Department of Primary Industries and Fisheries
Objectives Drivers • The declining cost of generating molecular marker data • The increasing costs of generating phenotypic data • The potential to generate greater genetic gain per $ • Context dependencies The objective of the PBMASS project was to develop a user friendly tool to allow breeders to make more efficient use of pedigree and molecular marker data in pedigree breeding programs
Outline • Key concepts: theory and definitions • Marker based pedigree analysis • Current and potential applications in breeding and pre-breeding
Quantitative Genetics Theory • The resemblance between relatives and contribution of shared genes to that resemblance underpins all quantitative genetic theory.
Concepts Reference population Identity by descent and Identity in state Coefficient of Parentage Linkage disequilibrium
Reference Populations • All members of a species are related to each other to some degree because they contain genes in common from a remote ancestor
Reference Populations For practical purposes we often define reference populations that are relevant to our breeding programs. For example define the reference population as all of the ancestors at the base of an observed pedigree and assume the ancestors are unrelated.
Coefficient of Parentage A measure for genetic relatedness between two individuals or varieties based on the based on the probability that a random gene drawn from one individual is identical by descent to a random gene at the same loci drawn from the other individual. The coefficient is calculated from pedigree data and values range 0-1
Gametic Phase Linkage Disequilibrium Gametic phase linkage disequilibrium can be defined as a non-random association between particular alleles at linked marker loci. LD can be created by selection (either natural or artificial) and by genetic drift due to inbreeding associated with small population size. The process of inbreeding and selection by which lines are commonly developed in breeding programs generates linkage disequilibria by favouring coupling phases for selected alleles, and fixing them in a homozygous condition.
Identity by Descent & Identity by State • Two genes with identical nucleotide sequences or band sizes or phenotypes can be said to by Identical by state (IBS) • Two genes that with identical nucleotide sequences or band sizes which and are direct descendants of a gene from a ancestral line are said to by identical by descent (IBD). By definition if two alleles are IBD they must be IBS
IBD vs IBS Molecular marker locus with three allelic states (A, B & C) 6 1 2 3 C C D A B IBS C D C A B C D C A B Marker of interest 2 3 4 5 6 7 1 C A A A B C D D A B 4 B 7 B A A 5 B A B C A A A A B C Reference Population C A C
IBD vs IBS Molecular marker locus with three allelic states (A, B & C) 3 D C C A B IBS D C C A B C C D A B Marker of interest 2 3 4 5 6 7 1 C A A A B C D D A B B B A A B A BCA AAA IBD B C C A IBD C 6 1 2 4 7 5
IBS vs IBD Why is the difference important? • LD between markers and genes is more likely to be retained if the even if marker is identical by descent • Marker assisted selection using marker loci that are IBD with those detected in mapping populations is more likely to be successful than use of markers that are IBS only
Properties of pedigree + marker data sets • Redundancy • Missing data • Errors • Pedigree • Genotyping
Redundancy • Pedigree/marker data sets contain a lot of information that is repeated or constrained as a result of the rules of inheritance Y= X X= 3 + 1 X= 2 + 2 X < 5 X >3
Uses of redundant information • Error detection and correction (relatives descendents siblings, linked markers) • Verification of pedigrees • Identification of genotyping errors • Inference of missing marker genotypes for individuals in a pedigree (genotype unavailable, missing data) • Extending data sets (virtual genotyping)
Checking for errors Allelic state Unknown State 1 State 2 State 3 When Dad isn’t really Dad ! P1 P2 A B C D E
Checking for errors Allelic state Unknown State 1 State 2 State 3 When Dad isn’t really Dad ! P1 P2 A B D E
Inferring data: What is the allelic state of P1? Unknown State 2 GP1 GP2 P3 P2 P1 Allelic state A B C D E State 1
Inferring data:What is the allelic state of P1? Allelic state Unknown State 1 State 2 P1 = GP1 GP2 P3 P2 P1 A B C D E
Inferring data:What are the allelic states of P1 and P2? Allelic state Unknown State 1 State 2 GP1 GP2 P3 P2 P1 A B C D E
Inferring data:What are the allelic states of P1 and P2? P1 = Allelic state P2 = Unknown State 1 State 2 GP1 GP2 P3 P2 P1 A B C D E
Inferring data:What are the allelic states of P1, P2 and GP1? P3 Allelic state Unknown State 1 State 2 State 3 GP1 GP2 P2 P1 A B C D E
Inferring data:What are the allelic states of P1, P2 and GP1? Allelic state Unknown State 1 State 2 State 3 P1 = GP1 GP2 P2 = GP1 = P3 P2 P1 A B C D E
Inferring data:What is the most likely allelic state for A? GP2 Allelic state Unknown State 1 P2 State 2 Probability A = = 0.25 Probability A = =0.75 GP1 A
Inferring data:What is the most likely allelic state for A? GP2 B Allelic state Unknown State 1 P2 State 2 O1 02 03 Probability A = = 0.013 Probability A = =0.987 GP1 A
Use of linkage and pedigree information to infer missing marker genotypes
1 1 2 3 Allelic state Unknown State 1 State 2 1 2 1 2 5.5cM P1 P2 1 2 O1 O1 = SSD line or RIL
Haldane and Waddington (1931) Haldane and Waddington (1931) r is the frequency of recombinant gametes in a single meiosis R is the proportion of recombinants
2 1 5.5 cM 2 3 Allelic state 1 2 Unknown State 1 State 2 1 2 1 2 P1 P2 3 1 2 O1 O1 = SSD line or RIL Probability that the genotype of O1 = is approximately 0.1
1 1 1 2 2 3 3 5.5cM 7.5cM Allelic state Unknown State 1 State 2 1 P2 P1 2 3 3 1 2 3 O1 O1 = SSD line or RIL
Haldane and Waddington (1931) Z = proportion of double crossover lines which result when a F1 with three genes A, B and C (i.e. ABC/abc) is inbred by self fertilisation. Where p = proportion of crossing over between AB, q = proportion of crossing over between BC r = proportion of crossing over between AC. For self fertilisation k = 2 and l = 2.
1 1 1 2 2 3 3 7.5cM 5.5cM Allelic state Unknown State 1 1 2 3 State 2 1 P2 P1 2 3 3 1 2 3 O1 Probability that the genotype of O1 = is approximately 0.0013
IBD Based Graphical Genotypes • The chromosomes of any individual consist of a mosaic of chromosome fragments from its ancestors • Combining pedigree, marker and mapping information allows the production of graphical representations of an individuals chromosomes showing the ancestral identity of particular genetic regions (ie IBD based graphical genotypes)
IBD Flow Chart Parent 1 Parent 2 Parent 3 True False Line 2 Line 1 IBS Parent 1 = IBS Line 1 IBD Parent 1 = IBD Parent 2 False False True True IBD Line 1 = IBD parent 2 IBD Line 1 = IBD Parent 1 IBD Line 1 = Line name IBD Line 1= IBD Parent 1 &2 IBS Parent 1 = IBS Parent 2
Words of caution • Graphical genotype is sensitive to errors in marker order (errors and biology) • High frequency of rare crossovers provides in graphical genotypes provides an alert to • Map error • Translocations • Selection for crossover individuals
Graphical Genotypes SC165C QL34 1 5 QL23 12622 QL33 B35 38 1 5 45 1 5 1 5 1 5 1 5 21 13 44 13 13 13 13 13 38 38 38 38 38 18 57 18 18 18 18 18 45 45 45 45 45 20 76 76 76 76 76 76 21 21 21 21 21 27 31 44 31 31 31 31 31 44 44 44 44 57 57 57 57 57 20 20 20 20 20 73 73 73 73 73 73 27 27 27 27 27 22 22 22 22 22 22 23 23 23 23 23 23 51 51 51 51 51 51 107 107 107 107 107 107 QL29 1 5 13 38 18 45 76 21 31 44 57 20 73 27 22 23 51 107 QL38 QL39 QL41 52209 QL40 1 5 1 5 1 5 1 5 1 5 13 13 13 13 13 38 38 38 38 38 18 18 18 18 18 45 45 45 45 45 76 76 76 76 76 21 21 21 21 21 31 31 31 31 31 44 44 44 44 44 57 57 57 57 57 20 20 20 20 20 73 73 73 73 73 27 27 27 27 27 22 22 22 22 22 23 23 23 23 23 51 51 51 51 51 107 107 107 107 107 QL34 SC165C QL23 86815 72399 72389 72442 12622 1 5 1 5 1 5 1 5 13 13 13 13 38 38 38 38 18 18 18 18 45 45 45 45 QL33 76 76 76 76 21 21 21 21 31 31 31 31 44 44 44 44 57 57 57 57 B35 20 20 20 20 73 73 73 73 27 27 27 27 22 22 22 22 23 23 23 23 QL41 51 51 51 51 107 107 107 107
Applications of PBMASS Graphical genotypes • Detection of regions under selection • Marker assisted selection • Validation of markers • QTL frequency and distribution • Tactical decisions about marker deployment • Alternative alleles • Extending marker data sets and using legacy markers • Information Sharing • Parent selection • Pedigree validation • Genealogical information for use in trial analysis • Detecting QTLs in breeding populations
Detection of Errors • Map order • Marker genotypes • Pedigrees
Detection of Regions Under Selection in Breeding Programs Jordan et al 2004. Comparison of identity by descent and identity by state for detecting genetic regions under selection in a sorghum pedigree breeding program Molecular Breeding 14: 441–454, 2004. Demonstrated that IBD based alleles out perform IBS alleles in detecting selection in pedigree breeding programs
Ancestral Identity of Chromosome Regions R. Klein, J.E. Mullet, D.R. Jordan, F.R. Miller, W.L. Rooney, M.A. Menz, C.D. Franks, and P.E. Klein. The Effect of Tropical Sorghum Conversion and Inbred Development on Genome Diversity as Revealed by High Resolution Genotyping. 2008. The Plant Genome A Supplement to Crop Science] March 2008 No. 1 Demonstrated capacity of PBMASS to track chromosome regions back through pedigrees to ancestral lines
Graphical Genotypes SC165C QL34 1 5 QL23 12622 QL33 B35 38 1 5 45 1 5 1 5 1 5 1 5 21 13 44 13 13 13 13 13 38 38 38 38 38 18 57 18 18 18 18 18 45 45 45 45 45 20 76 76 76 76 76 76 21 21 21 21 21 27 31 44 31 31 31 31 31 44 44 44 44 57 57 57 57 57 20 20 20 20 20 73 73 73 73 73 73 27 27 27 27 27 22 22 22 22 22 22 23 23 23 23 23 23 51 51 51 51 51 51 107 107 107 107 107 107 QL29 1 5 13 38 18 45 76 21 31 44 57 20 73 27 22 23 51 107 QL38 QL39 QL41 52209 QL40 1 5 1 5 1 5 1 5 1 5 13 13 13 13 13 38 38 38 38 38 18 18 18 18 18 45 45 45 45 45 76 76 76 76 76 21 21 21 21 21 31 31 31 31 31 44 44 44 44 44 57 57 57 57 57 20 20 20 20 20 73 73 73 73 73 27 27 27 27 27 22 22 22 22 22 23 23 23 23 23 51 51 51 51 51 107 107 107 107 107 QL34 SC165C QL23 86815 72399 72389 72442 12622 1 5 1 5 1 5 1 5 13 13 13 13 38 38 38 38 18 18 18 18 45 45 45 45 QL33 76 76 76 76 21 21 21 21 31 31 31 31 44 44 44 44 57 57 57 57 B35 20 20 20 20 73 73 73 73 27 27 27 27 22 22 22 22 23 23 23 23 QL41 51 51 51 51 107 107 107 107
Using markers in breeding programs • What is the ancestral origin of the genetic region of interest? • What alternate alleles are out there? • Am I already selecting for a QTL in that region? • How frequent is the QTL of interest? • Which crosses should I deploy markers in and how? • Which crosses might be good to make? • Develop cross specific breeding strategies (eg enhanced recombination) • Can I validate the QTL with breeding program data? • Can I detect QTLs using this data?
QL38 QL40 72389 72399 87151 Identity by descent B35 QL41 QL39 31429-2 QL40 QL41 72389 72399 87151 86815 72442 QRIL135 83373-3 30083 31429-2 31945-2-2 122 122 122 122 122 122 122 122 122 122 122 122 38 38 38 38 38 38 38 38 38 38 38 38 63 63 63 63 63 63 63 63 63 63 63 63 45 45 45 45 45 45 45 45 45 45 45 45 QL34 QL34 QL29 QL33 B35 QL39 QL41 86815 72442 30083
Expanding Marker Data Sets • Using inference relatively small numbers of genotyped individuals can be used to infer marker data for • Individuals that have not been genotyped • Using legacy marker data and integration across marker types.
marker inference
Information sharing • PBMASS offers enhanced capacity for sharing information between team members (pedigree, marker, phenotypic information) • Handy way to package information • Important tool for maintaining data integrity (names, sorting errors….)
Genealogical Information in the Analysis of Plant Breeding Trials Oakey et al 2006. Joint modeling of additive and non-additive genetic line effects in single field trials TAG 113:809-819 Information from relatives to can dramatically improve the plant breeders capacity to identify superior genotypes in field trials. Requires information on pedigree relationships to estimate relationships between individuals.