Download
1 / 22
220 likes | 371 Views
MS M ass S pectrometry. Organometallics. Centro de espectrometría de masa (Harvard). General Information The word that best describes the mass spectrometry of inorganic and Organometallic molecules is "difficult".

E N D
MSMass Spectrometry Organometallics
Centro de espectrometría de masa (Harvard) General Information The word that best describes the mass spectrometry of inorganic and Organometallic molecules is "difficult". Many species are intractable to mass spectrometry for one of a number of reasons. To see our recommendations for Organometallic, click here. Recommendations We recommend you confer with your friendly local mass spectrometrist before preparing any organometallic or inorganic samples for mass spectrometry.
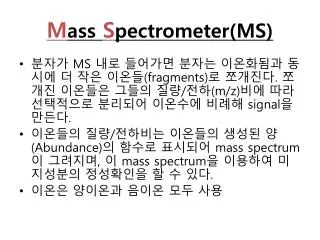
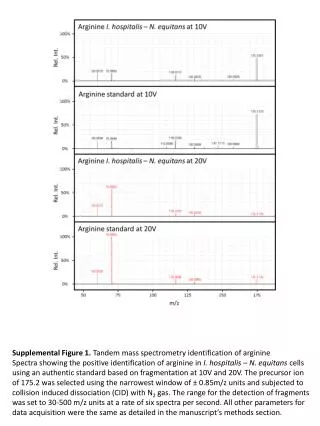
Métodos de Ionización (los más usuales) • EI(Impacto Electrónico): se volatiliza la muestra y se ioniza con un haz de electrones. M+. y fragmentos • FAB (Fast Atom Bombardment): se coloca la muestra en una matriz líquida (un alcohol) y se impacta con un haz de átomos de Xe. (M+H)+; (M+Na)+, (M+matriz)+, fragmentos, etc • MALDI (Matrix-Assisted Laser Desorption/Ionization): se coloca la muestra en una matriz sobre un metal y se impacta con un laser. Muy usado para péptidos y proteínas. • ESI (ElectroSpray Ionization):se disuelve la muestra, se pasa por un capilar a 5 kV, que la dispersa en microgotas. [M+nH]n+, [M+Na]+, etc.
Isotope patterns Aluminium Bromide: AlBr+27Al : 100% 79Br : 51% 81Br : 49%
Isotope patterns 63Cu35Cl 63Cu: 69.1% 35Cl: 75.5% 37Cl: 24.5% 63Cu37Cl 65Cu35Cl 65Cu: 30.9% 65Cu37Cl Abundance of first isotope peak M: .691 x .755 = .521 For next isotope peak: M+2: .691 x .245 = .169 } .403 .309 x .755 = .233 For next isotope peak: M+4: .309 x .245 = .076
Poly-isotopic metals Metal isotope pattern are distorted by 13C and 2H
Poly-isotopic metals When more than one metal is present: pattern is affected in a predictable way
Ru1 (bpy)(tpy)RuN2ArN2Ru(bpy)(tpy)? Ru2
Reacciones ion-molécula Se producen ocasionalmente, dando lugar a iones de MAYOR masa que el ion molecular. Cr(CO)6+ + Cr(CO)6 --> Cr(CO)10++ 2 CO
Fragmentation • The charge is likely to remain on Metal-containing fragment M Ln-1+ + L MLn L++ MLn-1 Less likely • Rearrangement involving hydrogen migration are frequent (M => Si, Ge, Sn, Pb…)
Fragmentation • Migration of Halogens is very common M (C6F5)3+ (C6F5)2 Sn F+ + C6F4 M => Si, Ge, Sn, Pb • Migration of Alkyl to metal is also common Transfer of R is influence by electronegativity of the R group
Rearrangement process “McLafferty” type of rearrangement involving metal instead of H This rearrangement depends on readiness of metal to become pentacoordinate (using it’s d-orbitals)
Carbonyl halide compounds Terminal Bridging
Carbonyl halide compounds Terminal Loss of CO and X occur with equal ease Bridging Loss of CO occur stepwise with retention of M2X2 than further X loss can occur
Cs2IrCl5CO (ESI-MS(-)) IrCl4CO- IrCl4- IrCl5CO2-
MSMS 199 (IrCl5CO2-) IrCl4CO- IrCl4-
FTMS • Fourier transform mass spectrometry, is a type of mass spectrometer for determining the m/z of ions based on the cyclotron frequency of the ions in a fixed magnetic field. • The ions are trapped in a magnetic field with electric trapping plates where they are excited to a larger cyclotron radius by an oscillating electric field perpendicular to the magnetic field. The excitation also results in the ions moving in phase (in a packet). The signal is detected as an image current on a pair of plates which the packet of ions passes close to as they cyclotron. The resulting signal is called a free induction decay (FID), transient or interferogram that consists of a superposition of sine waves. The useful signal is extracted from this data by performing a Fourier transform to give a mass spectrum.