Download
1 / 49
490 likes | 692 Views
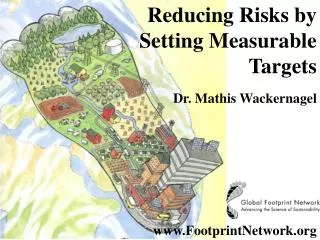
Footprint. Reducing Risks by Setting Measurable Targets. Dr. Mathis Wackernagel. www.FootprintNetwork.org. House. Are we getting to big for our house?. Global equity. Who is getting what?. If everyone lived like us we would need……. One hectare. How big is a hectare?.

E N D
Footprint Reducing Risks by Setting Measurable Targets Dr. Mathis Wackernagel www.FootprintNetwork.org
House Are we getting to big for our house?
Global equity Who is getting what?
One hectare How big is a hectare?
People vs. nature What about land for other species? ?
Bioproductive Segments 67% Low-Productivity Ocean Bioproductive segments 22% 4% Biologically Productive Ocean 11% Deserts, Ice Caps and Barren Land 18% Biologically Productive Land
Personal planetoid Global average availability of bioproductive Land + Sea = 1.9 global hectares/person
Footprint components Fossil Fuel Built-up Waste Food Fibres absorption
Global Footprint Global Footprint Accounts (in global hectares/person, 1999 data) Ecological Demand (Ecological Footprint) Ecological Supply (Biocapacity) Footprint Areas for: Biocapacity Areas: Growing Crops 0.53 Crop land 0.53 Grazing Animals 0.12 Grazing land 0.27 Settlements & infrastructure 0.10 Built-up area 0.10 Producing timber & fuelwood 0.33 Forest 0.86 Absorbing excess CO2 1.07 Harvesting Fish 0.14 Fishing Grounds 0.14 Total Global Demand 2.29 Total Global Supply 1.90 Demand Exceeds Supply By 20% >
Footprint data for 8 countries Footprint data for 8 countries
Footprint time series Footprint time series
What Does this Open up? • Accounting leads to accountability • Targets informed by risks associated with different scenarios • 2 simple choices: integrating climate change and biocapacity • Performance measure
Cat on Roman foot Mathis@FootprintNetwork.org www.FootprintNetwork.org
How big are YOUR feet??An ecological footprint is the amount of land used to support consumption and waste production. University of Toronto at Mississauga TRANSPORTATION footprint takes up 1347.64 hectares = A one lane highway stretching from TORONTO TO ORLANDO, FLORIDA AND BACK • What can YOU do to reduce YOUR footprint? • Walk or bike when you can – try out BIKESHARE! At the student center • Take public transit, or carpool to school • Buy a fuel efficient vehicle *Visit http://geog.utm.utoronto.ca/ecofootprint/ for more details
How big are YOURfeet??An ecological footprint is the amount of land used to support consumption and waste production. UTM’s WASTE AND MATERIALS footprint takes up352.39 hectares = A stack of 8.5 x 11 sheets of paper 4.7 KILOMETERS high What can YOU do to reduce YOUR footprint? • Print double sided at the library • Print two or four pages to a sheet • Use reusable containers for food and drinks *Visit http://geog.utm.utoronto.ca/ecofootprint/for more details
How big are YOUR feet??An ecological footprint is the amount of land used to support consumption and waste production. UTM’s FOOD use has a footprint of798.7 hectares = 2198 tonnes of wheat, enough to make 3 MILLION LOAVES OF BREAD • What can YOU do to reduce YOUR footprint? • Don’t waste food • Buy locally grown food • Eat less meat – meat uses more resources than other foods *Visit http://geog.utm.utoronto.ca/ecofootprint/for more details
How big are YOUR feet??An ecological footprint is the amount of land used to support consumption and waste production. A land area BIGGER THAN MANHATTAN What can YOU do to reduce your footprint? • Turn off your computer or TV when you’re not using it • Turn off all lights when you’re not in the room • Put on a sweater instead of turning up the heat UTM’s ENERGY footprint is6067.5 hectares = *Visit http://geog.utm.utoronto.ca/ecofootprint/for more details
How big are YOUR feet??An ecological footprint is the amount of land used to support consumption and waste production. 158 OLYMPIC-SIZED SWIMMING POOLS What can YOU do to reduce YOUR footprint? • Don’t let the water run when washing your hands • Take short showers • Only do laundry or run the dishwasher when you have a full load UTM’s WATER use footprint is19.8 hectares = *Visit http://geog.utm.utoronto.ca/ecofootprint/for more details
http://ecofoot.org/ • For example, each resident of a city is ‘responsible’ for a portion of the city’s infrastructure, such as roads, schools, and government offices, regardless of whether the resident uses those services. • …path to reducing your Footprint is to advocate for more sustainable decisions at all levels of government • How accurate is the Footprint Quiz? • We consistently use conservative estimates in Footprint calculations. As a result they tend to underestimate human demand on nature. Also, as discussed under "pollution and toxics," various aspects for which data is scarce are not yet included in footprints, making them appear smaller than they really are. • www.kidsfootprint.org.
What Size Shoe Do You Wear?Genuine Progress Index for Atlantic CanadaIndice de progrès véritable - AtlantiqueOctober, 2002
Ecological Footprint • The amount of productive land and water a given population requires to produce all the resources they consume and take in all the waste they make using prevailing technology (Onisto et al. 1998) • From a school perspective - EF = The space required to support all the inputs and outputs of the school body.
Sustainability Model • We can calculate how much biological productive area we have. • We can calculate how much we are using. • Living sustainable means that we are not living beyond what is available.
Measurements of Sustainable Development • Generally look at the “supply side” of the equation. Such measurements put the whole onus for sustainable development on the producer. • The “ecological footprint” looks at the “demand” side of the equation and places responsibility for sustainable development not only on the producer but on the consumer.
Components of the Ecological Footprint(six human activities that require space) • Growing Crops • Grazing Animals • Harvesting Timber • Catching Fish • Accommodating Infrastructure (housing, transportation systems, industry, built up land…) • Absorbing Carbon Dioxide Emissions (burning fossil fuels)
A region’s (person, school) ecological footprint is the total area required to produce the food and fibers that a region consumes, sustain its energy consumption, and give space for its infrastructure. • People consume resources from all over the world, so their footprint can be thought of as the sum of these areas, wherever they are on the planet.
The Bottom Line • 2.3 hectares of of biologically productive land and sea per person • set aside 12% as recommended by the Bruntland Commission to protect biodiversity = 2.0 hectares per person
Global Context • United States – 9.7 ha/capita • Canada – 8.4 ha/capita - NS - 8.1 ha/capita - AB - 7.9 ha/capita • France – 5.3 ha/capita • Japan – 4.8 ha/capita • Zimbabwe – 1.3 ha/capita • Bangladesh – 0.5 ha/capita Global Average: 2.3 hectares/capita
Ecological Footprint By Region (1996) • The size of each box is proportional to the aggregate footprint of each region. • The height of each box is propo rtional to the region's average ecological footprint per person; and • The width of the box is proportional to the population of the region. • (The OECD and non-OECD columns refer only to average ecological footprint per person).
EF Applications • Region (country, province, town, university campus) • Personal Ecological Footprint (redefining progress, mountain equipment co-op) • Competing technologies (fuel cells) • Growing Techniques (field tomato vs. hydroponic tomato) • Policy decisions (rail vs. road, urban planning decisions) • Purchase decisions (cradle to grave) • Other (big mac, aquaculture, newspaper)
Ecological Footprint in Use • Teach concepts of sustainability, environmental issues, responsibility. • Benchmark of School Sustainability (define current state, assess progress -- footprint increase? Footprint decrease?) • Means of Comparison (between schools, between grades, students vs. teachers) • Promote holistic decision making
Messages Behind the EF • Not all Footprints are equal Recap: • Average ecological space available per global citizen = 2.0 ha/cap • Average N.S ecological footprint = 8.1 ha/cap
Countries such as the United States, Australia, Canada, Singapore, New Zealand, Hong Kong, and Sweden occupy footprints over 200% greater than the 2.0 ha available per global citizen. This is dramatically contrasted to Bangladesh, Ethiopia, Pakistan, India, and Nigeria with footprints of 1 ha or less per capita.
The richest fifth: • account for 86% of total private consumption expenditures, the poorest fifth 1.3%. • consume 45% of all meat and fish, the poorest fifth 5% • consume 58% of total energy, the poorest fifth less than 4% • consume 84% of all paper, the poorest fifth 1.1% • own 87% of the world’s vehicle fleet, the poorest fifth less than 1% (UNDP, 1998).
In a world of limited resources and limited waste assimilation capacity, excess consumption by the rich literally requires that others live in poverty if we are not to exceed the Earth’s physical carrying capacity. Ecological footprint analysis cuts through the illusion that we can improve the living standards of the poor without curbing the excess consumption of the rich.
Websites: GPI Atlantic – www.gpiatlantic.org (Nova Scotia Ecological Footprint) Pembina Institute – www.pembina.org (Alberta Ecological Footprint) Redefining Progress - www.rprogress.org (Foundation site of ecological footprint work) WWF International - www.panda.org (Living Planet Report) Litterature: Lewan, Lillemor., Wackernagel, Mathis., and Carina Borgstrom Hansson, 1999. Evaluating The Use of Natural Capital With Ecological Footprint: Applications In Sweden and Subregions. Ph.D. work. Wackernagel, Mathis, and William E. Rees, 1996. Our Ecological Footprint: Reducing Human Impact on the Earth. New Society Publishers, Gabriola Island, BC. For details on the book, see www.newsociety.com/oef.html. Wackernagel, Mathis, Larry Onisto, Alejandro Callejas Linares, Ina Susana López Falfán, Jesus Méndez García, Ana Isabel Suárez Guerrero, Ma. Guadalupe Suárez Guerrero, 1997. Ecological Footprints of Nations: How Much Nature Do They Use? How Much Nature Do They Have? Commissioned by the Earth Council for the Rio+5 Forum. International Council for Local Environmental Initiatives, Toronto. Wackernagel, Mathis, 1998). "The Ecological Footprint of Santiago de Chile," Local Environment, Vol 3,, No. 2. Wackernagel, Mathis., Onisto, Larry., Patricia Bello, Callejas Linares, A.,Ina, López Falfán, I.S., Méndez García, J., Suárez Guerrero, A.I., and Suárez Guerrero, M.G., 1999. "National natural capital accounting with the ecological footprint concept," Ecological Economics, Vol. 29, pp. 375-390.