Download
1 / 17
170 likes | 365 Views
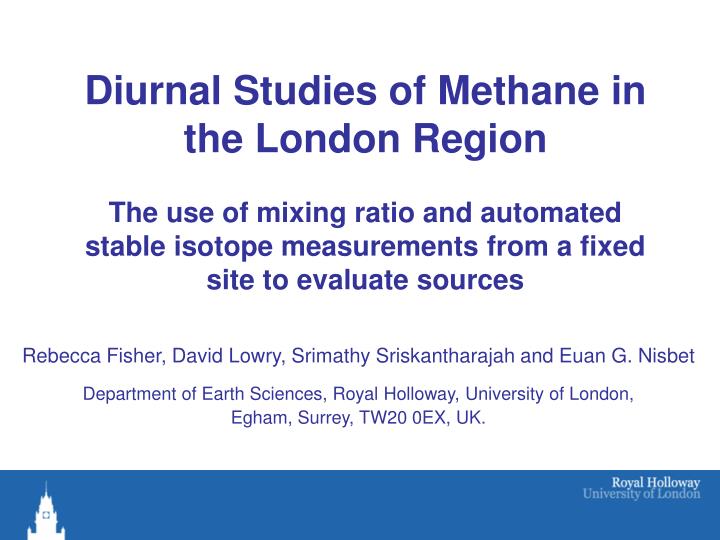
Diurnal Studies of Methane in the London Region The use of mixing ratio and automated stable isotope measurements from a fixed site to evaluate sources. Rebecca Fisher, David Lowry, Srimathy Sriskantharajah and Euan G. Nisbet Department of Earth Sciences, Royal Holloway, University of London,

E N D
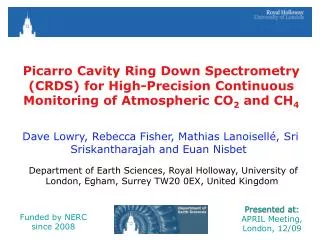
Diurnal Studies of Methane in the London RegionThe use of mixing ratio and automated stable isotope measurements from a fixed site to evaluate sources Rebecca Fisher, David Lowry, Srimathy Sriskantharajah and Euan G. Nisbet Department of Earth Sciences, Royal Holloway, University of London, Egham, Surrey, TW20 0EX, UK. AGU Fall Meeting, 10th – 14th December 2007
Outline • CH4 monitoring in the London region • In situ CH4 stable isotopic analysis using CF-IRMS • Diurnal studies of methane d13C • Diurnal and seasonal variations in the methane source mix • Implications for emissions inventory verification
Location of the Royal Holloway air monitoring site • 30 km WSW of centre of London, in Egham, Surrey • Air inlet 15 m above local ground, 45 m above London basin
Methane mixing ratio at Royal Holloway, Egham • CH4 mixing ratio monitored since 1995 • Measured at 30-minute intervals using HP 5890 GC-FID, current precision (±3 ppb) • Calibrated to the NOAA 04 scale • Decline of approximately 9 ppb/year over the last decade Monthly mean CH4 mixing ratio in Egham
Comparison of methane mixing ratio at Egham and Mace Head CH4 mixing ratio Egham – Mace Head (plotted by K. Masarie, NOAA) Mace Head Egham 2003 anomaly –heatwave across Europe • Decline in the excess of CH4 mixing ratio in SE England’s air over Atlantic Mace Head air, on average -5.5 ppb/year. • SE England methane emissions flux is growing more slowly than the background and appears to be decreasing in absolute terms. • Larger changes occurred in the late 1990s. Since then, UK methane emissions appear to have been nearly static. Question:Which sources have changed to drive the decrease in methane mixing ratio measured in SE England?
Another large source not included in the inventory: Landfill site emissions, -53 ± 4‰. • Most landfills in the Greater London area are now closed, but many continue to emit methane. Norlands Lane landfill site, 4 km from Royal Holloway London Atmospheric Emissions Inventory 2003 Emissions data from LAEI, published by the Greater London Authority, 2006. d13C = [(Rsample-Rref)/Rref] x 1000 ‰ where R=13C/12C. C reference is V PDB.
Methane d13C Monitoring (I) Conventional Offline Extraction / Dual Inlet Method Requires 60 litres of air per analysis. Offline combustion of CH4 followed by dual inlet mass spectrometry. Each analysis takes 2-3 hours to complete. Data precision is very high, 0.03‰ repeatability. Methane extraction line PRISM MS Technique described in Lowe et al., JGR Atmos, 1991.
Methane d13C analysis (II) Continuous Flow GC IRMS • Continuous flow techniques generally offer: • Smaller sample volume • Faster analysis time so higher sample throughput • Convenience of automation …but usefulness may be limited by the precision obtained. • GV Instruments’ Trace Gas connected to IsoPrime Mass Spectrometer in continuous flow set-up. • 75 mL of air for atmospheric samples. • 16 minute analysis time. • Changes made to automate inlet and improve precision (repeatability) to 0.05‰ for CH4d13C analysis. See Fisher et al., Rapid Communications in Mass Spectrometry, 2006.
Developments made to the Trace Gas at Royal Holloway Furnace catalyst: • Complete oxidation of CH4 to CO2 is a key step. • Different catalysts tested. • High precision using palladium powder on quartz wool catalyst at 790ºC. Automated valve inlet: • Up to 3 tanks/sample bags can be connected up and automatically analysed. • Or outside air pump connected and outside air analysed every 30 minutes.
Methane d13C monitoring – diurnal studies • High CH4 mixing ratio recorded under inversion – typically still, anticyclonic conditions. • Methane d13C measured at intervals throughout the night. Used to calculate the mixed source signature of regional sources. • This technique has been used in other urban areas to assess CH4 sources, e.g. Heidelberg, Germany (Levin et al., 1999). • Diurnal studies were carried out at Royal Holloway during events in 1996 – 1998. 22L SS tanks filled to 8 bar, collected at 2 hour intervals, analysed using offline extraction and dual inlet mass spectrometry (Lowry et al., JGR Atmos., 2001). • Since 2003 the automated continuous-flow Trace Gas system has been used for diurnal studies.
Diurnal study 4th-5th August 2003 Hot dry summer of 2003, high temperatures across Europe. Wind direction from East to North-east (London direction). Keeling plot: Mean overnight source signature: -55.8 ± 0.7‰, i.e. dominated by biogenic sources.
Diurnal variation in source signature Diurnal cycle of CH4 mixing ratio - background (2005) Isotopically enriched methane coincides with morning and evening rush hours and times when domestic boilers would be turned on d13C source signature (2005 diurnals)
Seasonal variation Mean overnight (22:00 – 06:00) d13C source signature during diurnal studies and mean monthly CH4 mixing ratio recorded at Royal Holloway in 2005 • CH4 more depleted in 13C during the summer months - biogenic CH4 production higher. • Enrichment in 13C during the autumn. Increased fossil fuel emissions.
Comparison between diurnal studies in 1996 and 2005 • Considering the London sector (45 to 110º): • In 1996: mean CH4d13C source signature was -48.7 ± 0.3‰ (Lowry et al., 2001). • In 2005: mean CH4d13Csource signature was -50.1 ± 0.7‰. • Likely to have been caused by a substantial decrease in emissions from gas leaks in recent years. This supports inventory estimates for London (LAEI). • 1998 inventory: 45460 Tonnes/yr CH4 from natural gas. • 2003 inventory: 29137 Tonnes/yr CH4 from naturalgas.
Emissions inventory verification • 2003 LAEI inventory suggests a methane source signature of -35.9‰. • From the diurnal studies: • 1996 measured value of -48.7‰ indicates source of 77% biogenic (landfill/sewage) and 23% fossil fuel (e.g gas leaks). • 2005 measured value of -50.1‰ indicates source of 85% biogenic and 15% fossil fuel. • If the source signature measured at Egham is typical of the source signature for London, then current inventory estimates are missing 167 kTonnes / year of biogenic source (e.g. landfill at -53‰). • This is an overestimation: the Egham site is closer to some biogenic sources (local landfills and ruminants) than is typical of the London area - future diurnal studies in central London are planned to measure the central London methane source signature.
Quantifying regional methane emissions: the radon tracer method Correlation between CH4 and 222Rn, 10th to 12th August 2005 • 222Rn, emitted at uniform rate from soils, builds up under inversion layer. Assume radon flux of 60 Bqm-2h-1 (mean flux for European soils – Eckhardt, 1990). • Methane also builds up under the inversion – measure concentrations of 222Rn and CH4 → calculate the CH4 emission rate. • Mean emission rate in 2005 calculated using this technique: 1.21 (± 0.69) g(CH4) km-2 s-1, equivalent to 94 ktonnes/yr for London. • Higher than London inventory estimate of 34 kT/yr - could account for the missing biogenic source implied in isotope studies. 2005 monthly averages of CH4 emission rate calculated using the radon tracer method
Meth-MonitEUr Conclusions • Long-term monitoring of CH4 mixing ratio and d13C from a single well-placed site can provide valuable insight into emissions from a region. • Results from the Royal Holloway site have highlighted the seasonal and diurnal variability of CH4 sources in the London region and suggested that biogenic sources such as landfill sites have a larger influence on methane emissions than implied in the London Atmospheric Emissions Inventory. • Reduction in methane emissions in the London region over the last decade appears to have been due to decreased emissions from gas leaks or other fossil fuel sources. • The instrumentation has the capability of being run continuously to get a half hourly record of methane d13C. This could be useful at either a moderately polluted site to evaluate regional emissions, or combined with back trajectory analysis at a background site to consider changes in sources over a larger area. Acknowledgements: