Download
1 / 16
160 likes | 271 Views
2008 Climate Highlights for the United States. Compiled by Karin Gleason and Chris Fenimore Climate Monitoring Branch. N ational C limatic D ata C enter. Overview Temperatures Precipitation Tornadoes Tropical Cyclones Midwest Flooding Drought.

E N D
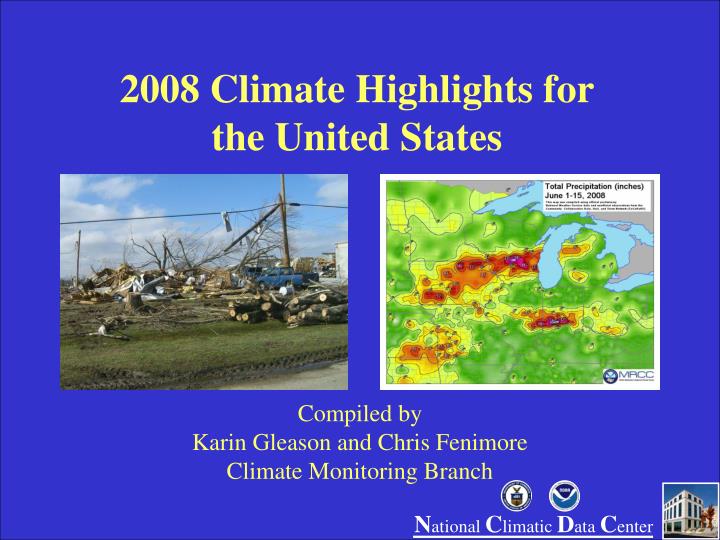
2008 Climate Highlights for the United States Compiled by Karin Gleason and Chris Fenimore Climate Monitoring Branch National Climatic Data Center
Overview • Temperatures • Precipitation • Tornadoes • Tropical Cyclones • Midwest Flooding • Drought 2008 Climate Highlights for the United States National Climatic Data Center
Temperatures • The 2008 YTD (Jan-Oct) preliminary national average temperature was 55.93°F (43rd warmest on record – near the LTM). • Most recent cooler YTD period occurred in 1996. • For YTD period (Jan-Oct), only 2 states with much above average temperatures (New Jersey & Delaware). • No large-scale heat outbreaks occurred on either a monthly or seasonal time scale during 2008. 2008 Climate Highlights for the United States National Climatic Data Center
Temperatures – cont’d • For YTD period (Jan-Oct), Southeast Region average temperature was 65.3°F, which is equal to the long-term mean. • On an annual basis, 2007 ranked 13th warmest across the Southeast Region with an average temperature of 64.1°F. 2008 Climate Highlights for the United States National Climatic Data Center
Precipitation • For YTD period (Jan-Oct), persistent wetness from the Great Plains to the Northeast. • Wettest YTD period for Missouri and New Hampshire. Second wettest for Illinois and Massachusetts. • The 2008 YTD (Jan-Oct) preliminary average national precipitation was 26.06 inches (26th wettest on record). • California had its driest Spring and March-August periods on record. 2008 Climate Highlights for the United States National Climatic Data Center
Precipitation – cont’d • Driest March-October period for West Region (CA & NV). Both 2007 and 2008 have been extremely dry. • Nevada had driest March-September period on record. 2008 Climate Highlights for the United States National Climatic Data Center
Tornadoes • 2nd largest January tornado outbreak on record with 54 confirmed tornado reports on the 7th & 8th. • February 5: The “Super Tuesday Outbreak” - 87 tornadoes occurred while 24 states held primary elections. - 57 deaths, the highest number of fatalities from a single outbreak since May 31, 1985 (76 deaths). 2008 Climate Highlights for the United States National Climatic Data Center
Tornadoes – cont’d • May was a very active month as 460 tornadoes were confirmed, making it the third most active May on record. • June had two additional outbreaks causing 289 confirmed tornadoes. • The high number of tornado-related fatalities during the first half of 2008 makes this one of the top ten deadliest January-October periods since reliable records began in 1953. 2008 Climate Highlights for the United States National Climatic Data Center
Tropical Cyclones General Overview & U.S. Landfalling Tropical Cyclones • Above average Atlantic TC Season: 16 named storms (avg. 11.0), 8 hurricanes (avg. 6.2), 5 major hurricanes (avg. 2.7). • Below average Pacific TC Season: 17 named storms (avg. 15.3), 7 hurricanes (avg. 8.8), 2 major hurricanes (avg. 4.2). U.S. Landfalling Atlantic Tropical Cyclones of 2008 2008 Climate Highlights for the United States National Climatic Data Center
Tropical Cyclones – cont’d North Atlantic Basin • Above normal activity: 4 storms formed before the start of August. • 2nd most destructive season on record with up to $54 billion in damage (2008 USD) ($128 billion reported in 2005). • 2008 is the only year on record in which a major hurricane existed in every month from July through November in the North Atlantic (Bertha, Gustav, Ike, Omar, and Paloma). • Earliest known date for 3 storms to be active on the same day: Hurricane Bertha, and Tropical Storms Cristobal and Dolly (July 20). • Tropical Storm Fay was the first tropical system on record to make landfall in one state four times. 2008 Climate Highlights for the United States National Climatic Data Center
Tropical Cyclones – cont’dAtlantic Major Storms (*Preliminary Statistics) 2008 Climate Highlights for the United States National Climatic Data Center
Midwest Flooding • Successive rain events across the Midwest caused significant flooding across portions of IA, IL, MO, IN and WI. • Record amounts of rainfall fell in the Upper Mississippi Basin in June setting 15 new all-time daily precipitation records. • 170 stations reported precipitation totals for June which ranked within their top five records. • 83 of Iowa's 99 counties were declared disaster areas by the state Governor. • Storms and flooding across six states killed 24 people, injured 148 and caused more than $1.5 billion in estimated damage in Iowa alone. 2008 Climate Highlights for the United States National Climatic Data Center
Midwest Flooding – cont’d 2008 Climate Highlights for the United States National Climatic Data Center
Drought • Severe to extreme drought across contiguous U.S. at the end of Dec ‘07 was ~18% (down to ~14% by end of Oct ‘08) (PDSI). • ~35% of contiguous U.S. was classified in moderate to exceptional drought (D1-D4, USDM) in January (down to ~21% by November). 2008 Climate Highlights for the United States National Climatic Data Center
Drought – cont’d • Drought remained entrenched across parts of the Southeast throughout the year, although the spatial extent was lessened by the end of the year. • California had its driest spring and March - August on record. The drought conditions fueled wildfires which made the 2008 fire season possibly the worst in California history. • Severe drought present across portions of Texas in mid-2008 was mitigated by Hurricane Dolly, TS Edouard and Hurricane Ike. 2008 Climate Highlights for the United States National Climatic Data Center
Drought – cont’d • Palmer Drought Index statistics for the contiguous U.S.: • Peaked at 31% moderate-extreme drought in Jun-Jul 2008 • Peaked at 29% moderate-extreme wet spell in Dec 2008 2008 Climate Highlights for the United States National Climatic Data Center