Download
1 / 15
150 likes | 290 Views
Convective Transport of Trace Gases and Lightning NO Production in Brazilian Thunderstorms. Jeremy Ott & Dr. Kenneth Pickering. Background. Convective Thunderstorms can transport trace gases from the boundary layer into the upper troposphere, and also produce lightning.

E N D
Convective Transport of Trace Gases and Lightning NO Production in Brazilian Thunderstorms Jeremy Ott & Dr. Kenneth Pickering
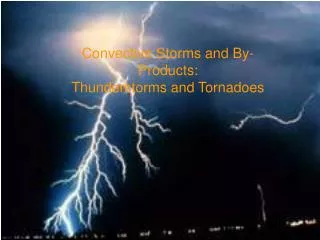
Background • Convective Thunderstorms can transport trace gases from the boundary layer into the upper troposphere, and also produce lightning. • IC and CG lightning flashes produce NOx, though the amount produced per flash is highly uncertain. Several previous studies have assumed that IC flashes produce much less (10%) NOx than CG flashes [e.g. Price et al., 1997]. • Uncertainty in the amount of NOx is produced per flash contributes to a wide range of estimates of annual global lightning NOx production (2-20 Tg(N)/yr). • NOx (NO + NO2) is a key player in the photochemical reactions that determine tropospheric and stratospheric O3.
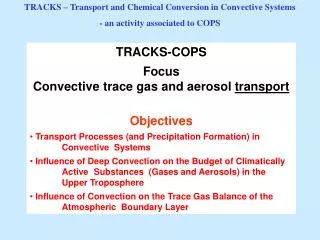
TROCCINOX • TROCCINOX (Tropical Convective, Cirrus and Nitrogen Oxide Experiment) • TROCCINOX was a field experiment that ran two campaigns one in February-March 2004 and the second in January-February 2005. General Goals of the project • To improve the knowledge about lightning-produced Nitrogen Oxides (NOx = NO + NO2) in tropical thunderstorms. • To improve the current knowledge on the occurrence of other trace gases and particles in the upper troposphere and lower stratosphere in connection with tropical deep convection. Base
TROCCINOX - Measurements • Three planes used: Falcon (10-12km), Geophysica(15-18km), and Bandeirante(0-3km). • Measurements included one second meteorological data from flights and ground observations as well as measurements of various trace gasses. Lightning Detection Network (LINET) 6 Station Network Sensitive network working at VHF/LF range with 3-D capability. Low-amplitude detection power especially of flashes under 10kA. Discriminative ability for IC (intra-cloud) and CG (cloud-ground) flashes.
February 4, 2005 Storm Radar 17 UTC 17:45 UTC
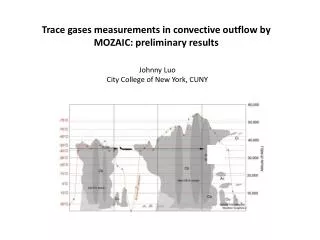
Satellite Images 17:45 UTC 18:45 UTC Location of Boxed Lightning: Latitude: -20.5 - -22.5 Longitude: -47 - -50 Flight Times: Bandeirante: 15:15 - 20:40 UTC Falcon: 17:48 – 21:22 UTC Geophysica: 17:02 – 21:22 UTC
Lightning Time Series for 2/4/05 The time is in seconds (UTC), where the beginning time is 14 UTC and ending is 21.5 UTC.
2-D Goddard Cumulus Ensemble Model (GCE) • Model used to compare the convective transport of trace gases to actual measured data. • Includes online calculations of cloud microphysics and tracer transport • Includes a parameterized source of lightning NOx production [DeCaria et al., 2000]. Initial Conditions: • Sounding data entered from Bauru sounding as well as a temperature profile extrapolated from flight data. • NO per mole of IC and CG flash calculated assuming a relationship between peak current and energy dissipated from Price et al. [1997]. IC = 195 mol NO/flash CG = 272 mol NO/flash • Undisturbed out-of-cloud vertical profiles of NOx, CO, and O3. - Out-of-cloud determined using aerosol spectrometer probe (fssp300) with a particle concentration less than .05 particles/cm3. - Nox computed using the photostationary state equations knowing O3 and NO concentrations to compute NO2.
Modeled Radar Reflectivity Model time frame corresponds to about 18:15 – 21:30 UTC
Model Output Compared with Aircraft Observations - Model mean NOx calculated using production of IC and CG flashes to be 43 mol NO/flash from Skamarock et al. [2003].
Summary • 2-D GCE model produced a comparable storm to observed cells. • Initial condition profiles of CO, NOx, and O3 were constructed from out of cloud aircraft observations. • In cloud mean profiles of CO and O3 calculated from the model simulation compared well with observations from the three aircrafts. • Lightning NOx production was estimated assuming a number of different production scenarios and comparing the results with aircraft observations to determine the best fit scenario.
Summary Continued… • Assuming a PIC = 195 and a PCG = 272 moles NO/flash resulted in a large overestimation of observed in cloud NOx. • Assuming PIC = PCG = 43 moles NO/flash from Skamarock et al. [2003] compares well with observed NOx. There estimate was calculated using data that included many short duration flashes, which may not be detected on all lightning detection systems and may not be productive of NO. • Further investigation of LINET data from TROCCINOX is needed to determine if weak flashes detected by the system are productive of NO. If not flashrates would be reduced and the production per flash would likely increase. • Additionally flashrates were calculated over a large area and the average number of flashes/km along the line of storms was used in the model. Calculating flashrates over a smaller area may also impact the estimate of production per flash.
Special Thanks TO: Research and Discover Program and NASA George Hurtt Dr. Pickering Lesley Ott QUESTIONS?