Download
1 / 24
240 likes | 349 Views
TE Wave Measurements Of Electron Cloud At CesrTA J. Byrd, M. Billing, S. De Santis ,M. Palmer, J. Sikora ILC08 November 17 th , 2008. Summary. Measurement technique outline. Practical considerations/Results interpretation. Measurement results (June, Nov. 2008). Future Plans.

E N D
TE Wave Measurements Of Electron Cloud At CesrTA J. Byrd, M. Billing, S. De Santis,M. Palmer, J. Sikora ILC08 November 17th, 2008
Summary • Measurement technique outline. • Practical considerations/Results interpretation. • Measurement results (June, Nov. 2008). • Future Plans.
TE-Wave Method for Electron Cloud Density Measurements Beampipe EM wave Low-energy electrons Phase velocitychangesin the ec region frev/Ntrain Signal Generator Positron current Receiver E-Cloud Density Bandpass Filter Amplifier Relative phase shift Isolator 180º Hybrid Beam Electron Cloud Induced phase modulation in the propagation of EM waves through the beampipe plasma frequency 2c(πere)1/2 -50/60 dB Gaps in the fill pattern set the fundamental modulation frequency (1st sideband). Higher order components depend on the transient ecloud time evolution during the gap passage. Experimental apparatus
Practical Difficulties • Low phase shift values (few mrad). Can we increase it ? • Frequency closer to beampipe cut-off higher attenuation • Longer propagation distance higher attenuation • Noisy environment: direct beam signals ! • BPM not optimized for TE-wave transmission/reception. • Typical Tx/Rx losses > -60 dB
Phase Modulation The periodic clearing of the electron cloud by the gap, when it passes between our Tx and Rx BPM’s phase modulates the transmitted signal: • What happens if the gap is not long enough to completely clear the electrons ? • What happens if the gap is shorter than the distance between Tx and Rx ? Amplitude modulation ? (Caspers) At very low modulation depth AM and PM are undistinguishable. b=D/2 is valid only for sinusoidal modulation. We have calculated correction factors for more realistic modulating signals (rectangularwave, sawtooth,…) If mod car
What are we really measuring ? ECD time Standing waves Reflections Ideal propagation Much larger electron cloud density, but same modulation depth. The gap is not long enough to completely clear the low energy electrons in the ----- case and the signal observed is about the same for two very different densities. Gap length studies, if possible, can help correct for this effect. We measure not only the average longitudinal distribution of the ECD… Propagation in a real accelerator environment is not simple.
What are we really measuring ? (cont.) …but also an average transverse distribution, as seen by the TE wave no magnetic field strong vertical magnetic field Different transverse distribution of the ECD. Formulas assume a uniform value, but dipole fields can concentrate low energy electrons in the centre of the pipe (M. Furman). TE wave E-field Furthermore, the ECD distribution is “sampled” by the TE field which is not uniform over the pipe transverse section: Conditions in the pipe centre count more towards the overall phase delay.
CesrTA Fill Patterns (e+/e-) Energy = 2 - 5.2 GeV Gap length ≈ 210 ns - 2.4 ms Revolution frequency ≈ 390 kHz Bunch spacing ≈ 14 ns 5-bunch train 45-bunch train 9x5-bunch trains A great flexibility in the fill pattern choice is available on Cesr-TA Can fill less than 9 trains
Location of Jun. 2008 Measurements SC Wiggler Replacement Chambers Dipole RFA B12W Dipole Replacement Chamber Different vacuum chamber shape, material (Cu WR, Al Dipole)
Transmitter/Receiver Positions We had 3 BPM available for the measurement, to be used either as transmitting or receiving port. By trying all the possible combination, we were able to test the effects of different vacuum chambers, different propagation lengths, and different propagation direction between e+ or e- beam and TE wave. The measurements were taken at both 2.0 and 5.2 GeV, with a variety of fill patterns. dipole wiggler replacement chamber e+ Q13W Q14W Q12W ~ 4 m ~ 6 m
Beampipe Transfer Function • Choice of measurement region: • Close to cutoff • Low attenuation • Reasonably “flat” Beampipe cutoff 1.8/1.9 GHz Search for origin of reflections and/or resonances in the beampipe did not turn out conclusive results (gate valves, pumping holes, RF cavity)
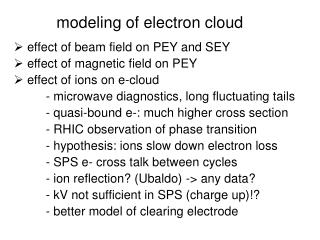
Measurements at CesrTA • Compare positron and electron beam • Build-up of low-energy electrons has also been observed with an electron beam. • Compare measurements with TE wave propagating in the same and in the opposite direction of the beam. • Dependence on gap length and beam/bunch current • Effects of different vacuum chamber shapes • Arc and wiggler replacement pipes. • Dependence on beam energy • More photoelectrons generated in the dipole at 5.2 GeV • Cyclotron resonance • Dipole field is 792 G at 2 GeV, fcycl=2.22 GHz
Electron vs. Positron Beam II 5.2 GeV - 12W-14W region - single train 1 mA bunches Difference -50.6 dB
Electron vs. Positron Beam Electron beam -59.9 dB 2 GeV - Dipole region (Q12W-Q13W) 10 bunches x 1 mA Difference in the relative sideband amplitude between electron and positron beam, in otherwise identical machine conditions. The low-energy electron density in the presence of a positron beam has a ~3 times higher value than with an electron beam. This effect is due to the multiplication of secondary electrons caused by resonant interaction of beam and e-cloud. Systematic comparison of the dependance of ECD on beam current between e+ and e- beams. -50.6 dB Positron beam
2 Gev vs. 5.2 Gev Measurements 5.2 GeV Ex-Wiggler region (Q13W-Q14W) 10 bunches x 1 mA -44.9 dB Difference in the relative sideband amplitude between two different beam energies (positron beam). At higher beam energy the enhanced production of photoelectrons increase the low-energy electron density by a factor greater than 2. Validate dependance on beam energy in theoretical models of the e-cloud. 2 GeV -51.9 dB
E-Cloud Rise/Fall Times Ex-Wiggler region (Q14W-Q13W) 45 bunches x 1 mA “Macro-trains” of variable length were used to detect saturation in the ECD growth. Flat top in the ECD translates into constant depth of modulation. More experimental data is needed. 8 4 6
9 x 5 Bunch Fill Pattern Ex-Wiggler region (Q14W-Q13W) 45 bunches x 1 mA Effects of the train periodicity are evident (enhancement of the ninth revolution harmonic ). Although total current is higher (45 vs. 10 mA). The much shorter gap (210 ns) induces a much smaller modulation depth. The ninth sideband is also enhanced. 9 x frev -61.2 dB 9 x frev betatron tune lines
Location of Nov. 2008 Measurements Each RF cable is connected to a set of 4 BPM’s. Total distance 17.4 m
Nov. 2008 Measurements (preliminary) Difference between positron/electron beam reduced from June measurements. Cu new vacuum chamber in CLEO straight not fully conditioned (higher primary photoelectrons ?).
Interpretation of Measurements • Reduced modulation depth due to short gap. • Experiments with variable gap lengths • Effects of train length on modulation spectrum. • Can be estimated theoretically, requires careful measurements of higher order sidebands. • Effects of beampipe attenuation function. • Can be measured and equalized. • Non-uniform transverse density of low energy electrons. • Can lead to overestimating ECD. Simulations can offer guidance. • Reflections/Standing Waves. • Uncertainty in the measurement region. Remedies: measurements of the vacuum chamber, directional couplers • Use of electron beam for normalization. • Needs some care: different synchrotron radiation functions for the two beams.
Future Activities • How to improve the measurements ? • Better, more stable signal generator/spectrum analyzer. • From BPM’s to dedicated couplers optimized for TE mode ? • More beamtime • CesrTA (multiple sidebands observation, time domain measurements) • Comparisons with studies on other machines (SPS, MI) • Better understanding of cyclotron resonances • More analytical work and modelling • Development of a dedicated receiver • Full demodulation of received signal (software, hardware)
Alternative fill patterns for future experiments These patterns allow to study different train/gap lengths at constant total current. Additionally, the electron beam signal can be used for normalization. 6 2 4 6 2 4