Download
1 / 31
310 likes | 426 Views
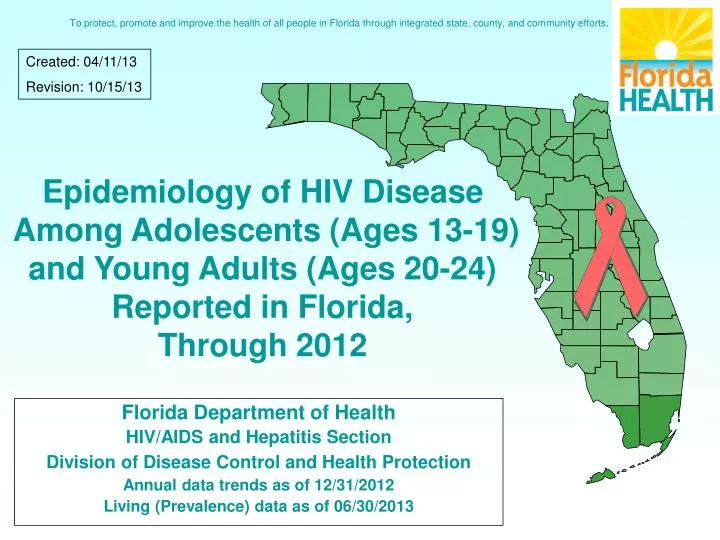
To protect, promote and improve the health of all people in Florida through integrated state, county, and community efforts. Created: 04/11/13 Revision: 10/15/13. Epidemiology of HIV Disease Among Adolescents (Ages 13-19) and Young Adults (Ages 20-24) Reported in Florida, Through 2012.

E N D
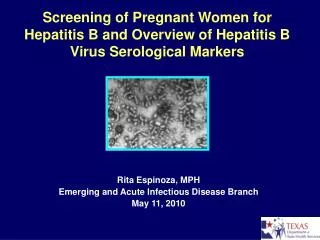
To protect, promote and improve the health of all people in Florida through integrated state, county, and community efforts. Created: 04/11/13 Revision: 10/15/13 Epidemiology of HIV Disease Among Adolescents (Ages 13-19) and Young Adults (Ages 20-24) Reported in Florida,Through 2012 Florida Department of Health HIV/AIDS and Hepatitis Section Division of Disease Control and Health Protection Annual data trends as of 12/31/2012 Living (Prevalence) data as of 06/30/2013
HIV and AIDS Case Data • HIV Infection reporting represents newly reported HIV cases, regardless of AIDS status at time of report. • AIDS cases and HIV infection cases by year of report are NOT mutually exclusive and CANNOT be added together. • Adolescents include ages 13-19, Young Adults include ages 20-24. • Unless otherwise noted, whites are non-Hispanic and blacks are non-Hispanic. • Total statewide data will include Department of Correction Cases (DOC) unless otherwise noted. County data will exclude DOC cases. • For data by year, the age is by age of diagnosis. For living data, the age is by current age at the end of the most recent calendar year, regardless of age at diagnosis. • HIV prevalence data are generated later in the year, usually in May, when most of the “expected” death data are complete. Selected slides from the Florida HIV Trends Slide Set, see site below for entire set.http://www.doh.state.fl.us/disease_ctrl/aids/trends/slides/slides.html
Definitions of Mode of Exposure Categories • MSM = Men who have sex with men • IDU = Injection Drug Use • MSM/IDU = Men who have sex with men & Injection Drug Use • Heterosexual = Heterosexual contact with person with HIV/AIDS or known HIV risk • OTHER = includes hemophilia, transfusion, perinatal and other pediatric risks and other confirmed risks. • NIR = Cases reported with No Identified Risk • Redistribution of NIRs = This illustrates the effect of statistically assigning (redistributing) the NIRs to recognized exposure (risk) categories by applying the proportions of historically reclassified NIRs to the unresolved NIRs.
Cases of AIDS Among Adolescents and Young Adults by Age at Diagnosis and Sex, Reported 2010-2012, Florida 13-19 years N=139 20-24 years N=520
Cases of HIV Infection Among Adolescents and Young Adults by Age at Diagnosis and Sex, Reported 2010-2012, Florida 20-24 years N=2,073 13-19 years N=637
Cases of HIV Infection Among Adolescents and Young Adults by Age at Diagnosis and Race/Ethnicity, Reported 2010-2012, Florida 13-19 years N=637 20-24 years N=2,073
Cases of HIV Infection Among Male Adolescents and Young Adults (Ages 13-24) by Race/Ethnicity and Year of Report, Reported 2003-2012, Florida Black White Hispanic Other* Note: Blacks represent the majority (> 46%) of male adolescent and young adult HIV infection cases each year. The proportion of male adolescent and young adult cases of HIV infection among whites and Hispanics have varied over the years. *Other includes Asian/Pacific Islander, Native American/Alaska Native, and Other races.
Black White Hispanic Other* Cases of HIV Infection Among Female Adolescents and Young Adults (Ages 13-24) by Race/Ethnicity and Year of Report, Reported 2003-2012, Florida Note: HIV case disparities are more evident among females than males. Blacks represent the majority (> 65%) of female adolescent and young adult HIV infection cases each year. The proportion of female adolescent and young adult cases of HIV infection among whites and Hispanics have varied over the years. *Other includes Asian/Pacific Islander, Native American/Alaska Native, and Other races.
MSM IDU MSM/IDU Heterosexual Perinatal Other Cases of AIDS Among Male Adolescents and Young Adults by Age at Diagnosis and Mode of Exposure, Reported 2010-2012, Florida 13-19 years N=91 20-24 years N=400
IDU Heterosexual Perinatal Other Cases of AIDS Among Female Adolescents and Young Adultsby Age at Diagnosis and Mode of Exposure,Reported 2010-2012, Florida 13-19 years N=48 20-24 years N=120
MSM IDU MSM/IDU Heterosexual Perinatal Other Cases of HIV Infection Among Male Adolescents and Young Adults by Age at Diagnosis and Mode of Exposure, Reported 2010-2012, Florida 13-19 years N=453 20-24 years N=1,691
IDU Heterosexual Perinatal Other Cases of HIV Infection Among Female Adolescents and Young Adultsby Age at Diagnosis and Mode of Exposure,Reported 2010-2012, Florida 13-19 years N=184 20-24 years N=382
AIDS and HIV Infection Cases AmongAdolescents and Young Adults by Race, Mode of Exposure and Age at Diagnosis, Reported in 2010-2012, Florida
Rates of Adolescents Aged 13–19 Years Living with Diagnosed Infection, Year-end 2010—United States and 6 Dependent AreasN = 8,631 Total Rate = 28.1 Note. Data include persons with a diagnosis of HIV infection regardless of stage of disease at diagnosis. All displayed data have been statistically adjusted to account for reporting delays, but not for incomplete reporting.
Rates of Young Adults Aged 20–24 Years Living with Diagnosed HIV Infection, Year-end 2010—United States and 6 Dependent AreasN = 30,404 Total Rate = 138.2 Note. Data include persons with a diagnosis of HIV infection regardless of stage of disease at diagnosis. All displayed data have been statistically adjusted to account for reporting delays, but not for incomplete reporting.
Statewide Data: N=3,822 Rate per 100,000, population 0 1 - 50 51 - 100 101 - 200 over 200 Rates* Among Adolescents and Young Adults Living with HIV Disease, by County of Residence**, Reported through 2012, Florida *Population data are from FloridaCHARTS **County totals exclude Department of Corrections cases (N=25). Numbers on counties are cases reported for persons aged 13-24.
Adolescents and Young Adults, Living with HIV Disease, Reported through 2012, Florida 70% resided in the following counties at the time of diagnosis: Dade County 24% Broward County 15% Orange County 8% Palm Beach County 8% Duval County 8% Hillsborough County 7%
Annual Prevalence of Adolescents and Young Adults Living with HIV Disease by Current Age Group, 1995-2012, Florida As a result of declining deaths, annual HIV/AIDS diagnoses have exceeded deaths since 1995, and the number of persons reported with HIV/AIDS that are presumed to be alive has been increasing. Since 2010 decreases in the annual prevalence of cases aged 13-19 have been observed, this could be a possible reflection of recent annual decreases in the birth of perinatal cases.
Adolescents and Young Adults Living with HIV Diseaseby Sex and Race/Ethnicity,Reported through 2012, Florida Males N=2,539 Females N=1,283 Note: Among those adolescents and young adults living with HIV, blacks represented the majority of cases for both males (65%) and females (75%). *Other includes Asian/Pacific Islanders and Native Alaskans/American Indians.
Adolescents and Young Adults Living with HIV Diseaseby Sex and Mode of Exposure,Reported through 2012, Florida MSM IDU MSM/IDU Heterosexual Perinatal Other Males N=2,539 Females N=1,283 Note: NIRs redistributed. MSM is the primary risk among adolescent and young adult males (72%), followed by perinatal exposure (19%) and heterosexual sex (6%). Heterosexual sex is the primary risk among adolescent and young adult females (51%), followed by perinatal exposure (46%).
Adolescents and Young Adults Living with HIV Diseaseby Sex, Race/Ethnicity, Current Age and Mode of Exposure, Reported through 2012, Florida
Young People and Sexual Risk*,2004-2009, Worldwide *The percent of people aged 15-25 years who had sex before age 15 year and the percent who had multiple partners in the past 12 months. Source: DHS and UN Population Statistics, UNAIDS Report on the Global AIDS Epidemic-2010
Nationwide, among current sexually active females aged 15-17, 49% reported condom use during their last sexual intercourse experience, and among sexually active males aged 15-17, 79% reported condom use during their last sexual intercourse experience. CDC. CDC Wonder. Data 2010. The Healthy People Database. Objective 09-10e-f. January 2010 edition.
Each year, one in four teens contracts a Sexually Transmitted Disease/Sexually Transmitted Infection (STD/STI). One in two sexually active persons will contract a STD/STI by age 25. Source: American Sexual Health Association (ASHA). (2013, March). ASHA Panel on the Estimates of STD Incidence, Prevalence and Cost. Retrieved April 11, 2013 from http://www.ashastd.org/std-sti/std-statistics.html
Chlamydia—Rates by Age and Sex, United States, 2011 Since 1994, Chlamydia has been the most frequently reported STD. During the last ten years, there was a significant increase in reported cases due to the expansion of Chlamydia screening methods. However, there are still many women who are not being tested due to lack of awareness and resources. Source: CDC. (2013). Sexually Transmitted Diseases Surveillance 2011. National Center for HIV/AIDS, Viral Hepatitis, STD, and TB Prevention. Division of STD Prevention. Retrieved on April 11, 2013 from http://www.cdc.gov/std/stats11/default.htm
Gonorrhea—Rates by Age and Sex, United States, 2011 Symptoms in males can take up to 30 days to appear, and some symptoms in women can be mistaken for other bladder or vaginal infections . In addition, if gonorrhea is left untreated it can cause infertility in both sexes. Source: CDC. (2013). Sexually Transmitted Diseases Surveillance 2011. National Center for HIV/AIDS, Viral Hepatitis, STD, and TB Prevention. Division of STD Prevention. Retrieved on April 11, 2013 from http://www.cdc.gov/std/stats11/default.htm
Primary and Secondary Syphilis—Rates, by Age and Sex, United States, 2011 Syphilis, is also known as “the great imitator,” because so many of its signs and symptoms are common in other diseases, making it difficult to tell apart. Many people with syphilis do not have any symptoms for years, although if left untreated this disease can lead to further complications such as severe damage to internal organs or death. Source: CDC. (2013). Sexually Transmitted Diseases Surveillance 2011. National Center for HIV/AIDS, Viral Hepatitis, STD, and TB Prevention. Division of STD Prevention. Retrieved on April 11, 2013 from http://www.cdc.gov/std/stats11/default.htm
Chlamydia Cases, by Sex and Race/Ethnicity, Reported in 2012, Florida Males N=22,008 Females N=55,224 Note: 29% of these cases are among adolescents, ages 15-19.*Other includes Asian/Pacific Islanders, Native Alaskans/American Indians and mixed races.
Gonorrhea Cases, by Sex and Race/Ethnicity, Reported in 2012, Florida Males N=9,915 Females N=9,489 Note: 22% of these cases are among adolescents, ages 15-19.*Other includes Asian/Pacific Islanders, Native Alaskans/American Indians and mixed races.
Primary and Secondary Syphilis Cases, by Sex and Race/Ethnicity, Reported in 2012, Florida Males N=1,237 Females N=135 Note: 6% of these cases are among adolescents, ages 15-19.*Other includes Asian/Pacific Islanders, Native Alaskans/American Indians and mixed races.
For Florida HIV/AIDS Surveillance Data Contact: (850) 245-4444 Lorene Maddox, MPH Ext. 2613 Tracina Bush, BSW Ext. 2612 Madgene Moise, MPH Ext. 2373 Visit Florida’s internet site for: Monthly Surveillance Reports Slide Sets and Fact Sheets Annual Reports and Epi Profiles http://www.doh.state.fl.us/disease_ctrl/aids/trends/trends.html Visit CDC’s HIV/AIDS internet site for: Surveillance Reports, fact sheets and slide sets http://www.cdc.gov/hiv/topics/surveillance/resources/reports/index.htm