Download
1 / 16
160 likes | 314 Views
Transport Colloquium 2006 Department of Transport and Regional Service The Level Playing Field: Does Government Need the Heavy Roller? Andrew Miller CEO, Centre for Asia Pacific Aviation. The operating environment of airlines is becoming increasingly complex. Intensified Competition

E N D
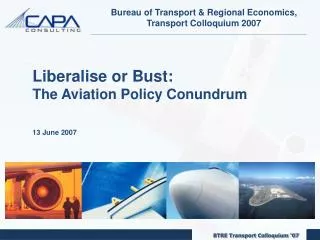
Transport Colloquium 2006Department of Transport and Regional Service The Level Playing Field: Does Government Need the Heavy Roller? Andrew Miller CEO, Centre for Asia Pacific Aviation
The operating environment of airlines is becoming increasingly complex. • Intensified Competition • LCCs Invading Markets • Growth of New World Carriers • Declining Yields • Regulatory Environment • Open Skies • Bilaterals • Capacity Constraints • Uncontrollable Threats • Epidemics (SAARS and Bird Flu) • Political Instability Full Service Carriers • Rising Costs • Rising Fuel Prices • Rising Airport Charges • High Operating Costs • Customers • High Customer Expectations • More Price-sensitive Customers • Increased Price Elasticity/Seasonality • Network and Aircraft Choice • Point/Hub to Point • Hub Bypass
US airlines fail to produce profits, while Europe, Asia weather it better. 2005 2006F Jet fuel prices at record highs Loss of US$6.7 Loss of US$5.2b US Competition escalates; LCC growth Profit of US$1.6b Profit of US$1.3b Europe Capacity pressures in key markets Profit of US$2.1b Profit of US$1.7b Asia Pacific Total Loss of US$3.2b Total Loss of US$3.0b Source: IATA Estimates
The DNA of geography, technology and history. Dubai Sao Paulo Johannesburg
Aircraft choice: point to point versus hub to hub Source: Boeing
Globally, the confidence up… but is it misplaced? Asian Crisis Recession 9/11 Source: CAPA Analysis
Despite uncertainty, aircraft order books fill to overflow - driven by costs, new types. 40-50% of total orders in 2005; mostly narrow bodies. 1,217 aircraft due for delivery Source: CAPA Analysis
Australian inbound traffic by carrier 2.7% 22.07% 3.2% 20.64% 3.2% 17.4% 3.4% 7.0% 3.6% 10.0% 5.1% 10.1% 12.4% 12.6% 12.6% 32.5% 35.6% 35.8% Source: BTRE
Key differences between legacy carrier costs and LCC’s costs. With a lower cost base, Singapore Airlines and Emirates have an advantage. 10 US c/ASK Qantas’ main focus in cost saving initiatives 5 US c/ASK Note: Legacy carrier and LCC c/ASK are industry averages Source: CAPA Analysis
Launching its own LCC, Jetstar, is the only way for QF to fight competitor Virgin Blue head-on for the price-conscious customer. Example: JetStar’s Role in Containing Growth of Virgin Blue Billion of RPKs (Australia Domestic) JetStar Virgin Blue Qantas Source: CAPA Analysis
Air New Zealand maintains market share, despite small gains by Emirates, Pacific Blue Emirates 9% Pacific Blue 7% Air New Zealand/ Freedom Air 48% Qantas 36% 2004 2005 Source: BTRE
The relationship between liberalisation and economic growth Traffic Growth Job Growth Liberalisation Newer and Better Air Services Economic Growth Source: CAPA Analysis
The growing conflict between liberalisation and ownership controls Ownership Controls Prevention of consolidation/merger Support of protectionism Limitation of prospects for multilateralism Limitation of local capital markets Liberalisation New airlines LCC growth as major driver New routes and additional capacity Pressure on legacy carriers to restructure Tourism growth
Examples of liberalisation events and results Source: CAPA Database
Summary The DNA of geography, technology and history determines liberalisation requirements with a strong regard to tourism as a powerhouse of GDP. Despite tough operating conditions, confidence is up and aircraft orders increased significantly. Traffic growth subsequent to liberalisation of air services agreements between countries typically averaged between 12% and 35%. Global liberalisation of 320 non-deregulated country routes would result in a 63% traffic growth, create 24.1 million jobs and generate an additional USD490 billion in GDP. Liberalisation facilitates market access for foreign carriers and normally results in lower market share for flag carriers.