Download
1 / 43
1.45k likes | 3.62k Views
The Soft Drink Industry. Jonathan Gacioch Alec Kane Taylor Wilson. Introduction. Why soft drinks? $17.6 bn estimated revenue ($739.2 m profit) Falling demand is driving innovation Unique pricing strategies and monopoly power through exclusive contracts

E N D
The Soft Drink Industry Jonathan Gacioch Alec Kane Taylor Wilson
Introduction • Why soft drinks? • $17.6 bn estimated revenue ($739.2 m profit) • Falling demand is driving innovation • Unique pricing strategies and monopoly power through exclusive contracts • Average Americans consume 44 gallons per year • Customer loyalty
Challenge VS.
Industry Structure Background, Competition, Organization, Major Companies
Background • What does the industry produce? • Mixes ingredients with carbonated water • Package and distribute beverages • Does not include: • Still beverages • Carbonated water • Functional beverages (e.g. energy drinks) • Companies that only produce beverage ingredients or distribute beverages Source: IBISWorld
Background • What is the basic technology? • Combining water, flavorings and sweeteners, and carbonating this mix, and then packaging • Natural sweeteners to limit calorie content • Energy efficiency in production and biodegradable plastic bottles with smaller caps • How are the products distributed? • Producers ship their products significant distances to a large number of markets • Completed in-house by larger producers • Outsourced by smaller producers (often to larger players) Source: IBISWorld
Background • Who buys the products? • Consumers buy soft drinks in both supermarkets and food services and drinking places • Demographics for sugar drink consumption:* • Young people and men consumer sugar drinks more frequently • Lower income individuals consumer more sugar drinks in relation to their overall diet *Ogden CL, Kit BK, Carroll MD, Park S. Consumption of sugar drinks in the United States, 2005–2008. NCHS data brief, no 71. Hyattsville, MD: National Center for Health Statistics. 2011.
Background Ogden CL, Kit BK, Carroll MD, Park S. Consumption of sugar drinks in the United States, 2005–2008. NCHS data brief, no 71. Hyattsville, MD: National Center for Health Statistics. 2011.
Background Ogden CL, Kit BK, Carroll MD, Park S. Consumption of sugar drinks in the United States, 2005–2008. NCHS data brief, no 71. Hyattsville, MD: National Center for Health Statistics. 2011.
Competition • How many firms are there in the industry?
Competition • Herfindahl-Hirschman Index (HHI): • Moderately concentrated industry
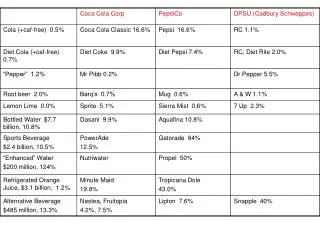
Major Companies • The Coca-Cola Company • PepsiCo Inc. • Dr Pepper Snapple Group Inc. • CottCorporation
The Coca-Cola Company • Largest company in terms of market share and revenue • Major Brands: • Coca-Cola • Diet Coke • Sprite • Fanta • Revenues boosted by consolidation • Recently acquired companies to move away from carbonated soft drinks: • Honest Tea
PepsiCo Inc. • Challenged Coca-Cola during the Great Depression with a 12 oz. bottle (same price compared to 6.5 oz. Coca-Cola) • Notable marketing: Pepsi Challenge (1975) • Major Brands: • Pepsi • Mountain Dew • Sierra Mist • Mug Root Beer • Izze
Dr Pepper Snapple Group Inc. • Former division of Cadbury Schweppes Americas Beverages • Brand owner, bottler, and distributor • Limited offerings in healthy beverages will hurt the company in the future • Major Brands: • Dr Pepper • 7-UP • Schweppes • A&W Root Beer • Canada Dry • RC Cola
Cott Corporation • Largest producer of private label soft drinks • Sells to Safeway and J Sainsbury, which label the beverages with store brands • Success in Canadian market by lowering production costs while maintaining quality and improving packaging graphics • Cancelled contract with Walmart negatively impacted revenue in 2008 Source: IBISWorld
Competition • High levels of product differentiation: • Make entry into the market difficult • Entrants must differentiate themselves from other products • Alternatively, entrants might find specific niches • Existing producers have achieved economies of scale: • Capital investment is required in the mass production
Organization • Increasing trends of vertical integration: • The Coca-Cola Company formerly sold rights to mix and bottle its beverages • Acquired Coca-Cola Enterprises in December 2010 • Combine marketing, distribution, and bottling • PepsiCo started reintegrating its bottling in July 2009 • Completed acquisition of Pepsi Bottling Group and PepsiAmericas in February 2010
Collegiate Contracts Eliminating Competition to Gain Full Pricing Power
Collegiate Contracts • Exclusive rights to distribute on campus • Most based on 90:10 ratio for shelf space • Includes both vending machines and in-store • Ad space/sports
Incentives for Soda Companies • Eliminating competition=pricing power • Reduces the effect of preference • If you can only get Pepsi, you’ll get Pepsi • College years are habit forming • Investment to generate brand loyalty • Exclusive advertising and sales rights
Incentives for Colleges • “We looked at it as we could offer different soft drinks and get nothing or just offer Pepsi products and bring in a lot of money the University otherwise wouldn’t have.” -Bill Mahon, Penn State Spokesperson
Coca-Cola vs. Pepsi 2/3 ~1500 750 1/3 Source: Scott Jacobson (Coca-Cola Spokesman)
Penn State University (Pepsi) • 77,000 students • Signed 1992 • First collegiate contract • 10-year • $14 Million
University of Minnesota (Coke) • 37,000 students • Signed 1998-2013 • $28 million • Student life and athletics
Advertising Raw Data Television Ad Costs (2011)
Collusive Behavior Evidence for tacit collusion in the soft drink industry
Collusive Behavior • Through our own research we found that the prices of soft drinks made by each of the big 3 producers are identical to each other. • Prices for Coke and Pepsi products were exactly the same at numerous Ithaca locations (Wegman’s, 7-11, etc.). • This suggests tacit collusion on prices.
Collusive Behavior • A Journal of Economics and Management Strategy study explored the possibility of tacit collusion in the industry. • The study covered the years from 1968-1986 and focused on Pepsi and Coca-Cola • Findings suggest that there is collusive behavior in advertising, but not in pricing
Collusive Behavior • Have things changed since the 1980s? • Is there collusion in pricing now that wasn’t there previously?
Pricing in the Ithaca Area Are you paying more for your drinks depending on your location?
Geographic Segmentation • Is there a difference in the price of a soft drink depending on where you are? • Are soft drinks more expensive on Cornell’s campus than they are off-campus?
Geographic Segmentation • Our research showed that soft drinks are in fact almost the same price per ounce whether you are on or off-campus. • Note that on-campus prices only include Pepsi products, as Cornell has a contract with them.
Other Pricing Differences • Cans of soda are more expensive than bottles per ounce, though not by much (between .5 and 2 cents per ounce) • 2 Liters of soda are significantly cheaper per ounce than 12 oz cans or 20 oz bottles • A 2 Liter of soda at Wegman’s is the same price as a 20 oz bottle. • Pricing takes advantage of those who buy single servings (can or bottle).
Investment Recommendations Is the soft drink industry a wise place to invest your money?
Recommendations • Prices of sugar and other inputs of production are rising much faster than the price of soda • Revenues for the industry have been falling for over a decade • Revenues for 2013 are projected to be less than 70% of what they were in 2003
Recommendations • We would not suggest investing in the industry. • Steadily rising cost of inputs suggests that industry revenues will not increase any time in the near future. • Demand for soft drinks is steadily decreasing as people search for healthier options.