Download
1 / 19
190 likes | 291 Views
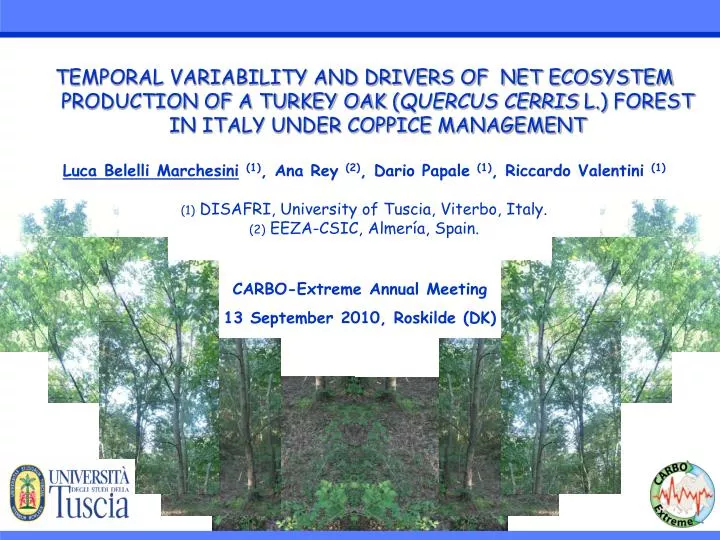
TEMPORAL VARIABILITY AND DRIVERS OF NET ECOSYSTEM PRODUCTION OF A TURKEY OAK ( QUERCUS CERRIS L.) FOREST IN ITALY UNDER COPPICE MANAGEMENT Luca Belelli Marchesini (1) , Ana Rey (2) , Dario Papale (1) , Riccardo Valentini (1) (1) DISAFRI, University of Tuscia, Viterbo, Italy.

E N D
TEMPORAL VARIABILITY AND DRIVERS OF NET ECOSYSTEM PRODUCTION OF A TURKEY OAK (QUERCUS CERRIS L.) FOREST IN ITALY UNDER COPPICE MANAGEMENT Luca Belelli Marchesini(1), Ana Rey (2), Dario Papale (1), Riccardo Valentini (1) (1) DISAFRI, University of Tuscia, Viterbo, Italy. (2) EEZA-CSIC, Almería, Spain. CARBO-Extreme Annual Meeting 13 September 2010, Roskilde (DK)
Activities during the first year of Carbo-Extreme project (WP3): • Analysis of a long-term eddy covariance dataset from Roccarespampani site (coppice forest in central Italy): 15 years of continuous NEE data representative for forest stand age from 0 (post-harvest) to 18 years covering almost the whole rotation period. • Inter-annual and seasonal variability of NEE, GPP, Reco • Climatic drivers (functional relations) of the C cycle and disturbance induced by coppice management. • Separation of age and climate as factors controlling the temporal trend of the C balance by Artificial Neural Networks (AANs). (preliminary) • Comparison of NEE with modelled NPP (inventories+ allometric functions) and assessment of NBP. (not shown here)
Stand after coppicing reserve trees Sites location and applied management Mature stand shoots (42.4082 N ; 11.9303 E) Roccarespampani Coppice forest ~1250ha Two eddy covariance sites (42.3903 N; 11.9209 E)
EC data set Chronosequence reconstructed by assembling the dataset of 2 EC stations Standard Carbo-Europe data processing (QA, gapfilling, partitioning) time since forest harvest 0 18 GPP Reco NEE Rocca 1 (2000-2008), harvested in Dec. 1999 Rocca 2 (2002-2008), harvested in Dec. 1990 Similar soil features, specific composition, topography, same management
Rocca 1 Rocca 2 Seasonal trend of NEE NEE (g C d-1) NEE [gC m-2 d-1] NEE (g C d-1) doy
CO2 fluxes response to air temperature Dry period Daily fluxes Gap filling fQC1>=90% Ecosystem respiration (Reco) NEE Soil Water Content (-10 cm) Vapour Pressure Deficit GPP
2008 R1 2007 Duration of seasons 2006 Growing season winter 2005 spring dry period 2004 fall 2003 R2 R2 R2 R2 R2 R2 R1 R1 R1 R1 R1 R1 2002 R1 2001 Relative importance of “physiological” seasons doy
Importance of different seasons on annual NEE Which period influences mostly the annual C balance? Correlation analysis (ρ- Spearman): Annual mean flux vs Mean flux of each period
NEE inter-annual variability source sink Carbon budget 2000 2002 2003 2008 2001 2004 2008 2002 2004 2005 2006 2003 2007 2006 2005
Reco, GPP inter-annual variability Decreasing Reco/GPP ratio 2006 2005 2004 2004 2006 2007 2002 2003 2002 2005 2001 2008 Trend of Reco consistent with that of soil respiration (Tedeschi et al., 2006) 2003 2008 2000 2002 2004 2003 2001 2004 2006 2000 2002 2006 2003 2005 2007 2008 2008 2005
Influence of climate on NEE, GPP. Reco inter-annual variability NEE inter-annual variability and climatic factors Multiple regression (forward step-wise) : Ta, Ts, PPT, Rg (annual-growing season); Ta, PPT anomalies (JJA); PPT anomaly (Jan-May) NEE R= .95 R²= .91 Adjusted R²= .86 F(4,8)=20.421 p<.00029 Std.Error: 115.96 GPP R= .81 R²= .66 Adjusted R²= .53 F(4,10)=5.0438 p<.01736 Std.Error : 197.72 Reco annual R= .91 R²= .82 Adjusted R²= .76 F(3,9)=13.993 p<.00098 Std.Error: 89.931
Clear cut effect cooler soil warmer soil Warming effect of clear cut on forest microclimate *mean values of August
Reco- Tsoil dependence Increased soil temperature after coppicing, but same temperature sensitivity? Analysis of parameters of the Reco-Tsoil curve (Rref, Q10), for the winter-spring (WS) and fall-winter (FW) periods.
Q10 function parameters Q10 Q10 difference beween WS and FW (Wilcoxon test p=0.02). Q10 in the WS period significantly varies with age (R2=0.41, p<0.05) Rref Significantly higher in the WS period compared to FW (Wilcoxon test: P=0.013) Decreases with stand age, both in FW (R2 0.61, p<0.001);and WS(R2=0.48, p<0.01) Rref
Conclusions • Coppice management of Roccarespampani forest associated to high C sequestration rates and limited duration of net C release following clear cuts (C budget <0 already after 2years ) • Sink strenght increases primarily with age, but negatively impacted by warmer temperatures and droughts. • Enhanced ecosystem respiration after coppicing, independently of the altered microclimate (input of C,N through biomass residuals/root mortality). • Importance of taking into account the role of forest management on ecosystem carbon dynamics together with climatic drivers.
Outlook on next activities (1/2) Analysis of eddy covariance data from forest sites differing for plant functional type with long time series available:
Outlook on next activities (2/2) In particular: • Use of ANNs to disentangle stand age and climate effects on NEE time series of forest ecosystems and single out main drivers of NEE variability. (Roccarespampani forest) Observed NEE 18 years old stand (simulation) • Explore the use of copula (C) functions (Genest & McKay, 1986) Example of 3-copula: Joint probability density function of (x1,x2) , given x3 F(x1,x2)/x3 which synthesize the dependence structure of data, regardless of marginal distributions (Fx1,Fx2,..), to produce multivariate probability functions of NEE and climatic drivers and individuate thresholds for different climate domains. x2 X1 (from Grimaldi & Serinaldi, 2006)
Thank you for your attention! More information: Luca Belelli (belelli@unitus.it)
Tair anomaly (°C) PPT anomaly (mm)