Download
1 / 19
190 likes | 341 Views
Medium-Size Telescope Science Workshop East Asian Core Observatories Association (EACOA ) June 21-25,2013, Kunming, China. Site Session 9:45-10:05, June 23, 2013. Excellent daytime seeing at Dome Fuji on the Antarctic Plateau. Based on Okita et al., A&A, 554, L5 (2013)

E N D
Medium-Size Telescope Science Workshop East Asian Core Observatories Association (EACOA) June 21-25,2013, Kunming, China Site Session 9:45-10:05, June 23, 2013 Excellent daytime seeing at Dome Fuji on the Antarctic Plateau Based on Okita et al., A&A, 554, L5 (2013) and some unpublished results Hirofumi OKITA Astronomical Institute, Tohoku University Ph. D student 54th Japanese Antarctic Research Expedition, Summer party (2012-2013) 52nd Japanese Antarctic Research Expedition, Observer (2010-2011) Coauthors: Takashi Ichikawa, Michael C. B. Ashley, TakatoNaruhisa, and Hideaki Motoyama
1. Introduction 1.1 Aim of this study The aim of this study is to investigate the astronomical seeing in the free atmosphere above and to determine the height of the surface boundary layer at Dome Fuji on the Antarctic plateau. Murata et al. 2009
1. Introduction 1.2 Turbulence in the Atmosphere Object Atmosphere (Turbulence layer) Telescope Bright Star (Arcturus) Observed with Lick Observatory's 1-m Telescope.(Copyright: Claire Max, http://cfao.ucolick.org/EO/resources/History_AO_Max.pdf)
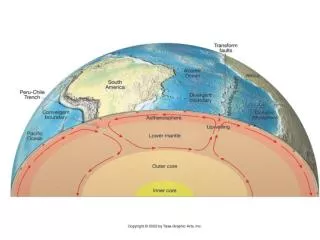
1. Introduction 1.3 Atmosphere structure No jet-stream on the Antarctic plateau Height Free Atmosphere Troposphere ~10km FA seeing < 0.3” 200 ~ 10 m SBL seeing > 1” Surface Boundary Layer Astronomical seeing on the Antarctic plateau is generally considered as the superposition of the contributions from two layers; the surface boundary layer and the free atmosphere above.
1. Introduction 1.4 Simulations’ results Dome Fuji Swain & Gallee (2006) Simulation of the height of the surface boundary layer Saunders et al. (2009) Simulation of the free atmosphere seeing • The free atmosphere seeing could be 0.21”. • The height of the surface boundary layer would be 18 m. We planed to observed them at Dome Fuji.
1. Introduction 1.5a DIMM instrument Differential Image Motion Monitor (Sarazin & Roddier 1990) d DIMM measures the variance of the incidence angles on the detector CCD. Incidence angle structure function Phase structure function Fried parameter seeing
1. Introduction 1.5b DF-DIMM Dome FujiDifferential Image Motion Monitor We used an exclusive small full-automatic telescope on the 9 m astronomical tower in order to be as height as possible within, and sometimes above, the surface boundary layer. Power supply, Communication DF-DIMM PLATO-F 11m
2. Results 2.1 Histogram of seeing • From January 4 to January 23, 2013 • 3768 seeing estimated, each one being the average of 450 images over a period of about five minutes • 11 m above the snow surface • Wavelength of 472nm We expect the higher seeing measurements to be due to periods when the surface boundary layer was above the level of the top of the telescope.
2. Results 2.2a Time series of seeing(1/2)
2. Results 2.2b Time series of seeing (2/2)
2. Results 2.3 Tendency of seeing • The seeing has a tendency to have a local minimum of ~0.3” a few hours before local midnight (around 18h). • This is clear in the data for January 6,7,9, and 16. • A period of excellent seeing, below 0.2” and continuing about 4 hours, was observed near local midnight at 2013 January 6. • Other periods of excellent seeing, less than 0.3”, were observed close to midnight on a total of six occasions (January 6, 11, 15, 19, 21, and 23)
2. Results 2.4 Excellent seeing Height Free Atmosphere ~10km A) B) C) We can consider three cases; the surface boundary layer is disappeared at all. below the level of the telescope. higher than the level of the telescope. 10 ~ 200 m Surface Boundary Layer When there is case A) or B), we can get free atmosphere seeing at a height.
2. Results 2.5 Disappearance of the SBL Local minimum around 18h • A similar local minimum at local dusk has also been seen at Dome C. • Aristidi et al. (2005) has interpreted this as the disappearance of the surface boundary layer. Our results are consistent with this. Case A)
2. Results 2.6 Above SBL • The excellent seeing at local midnight has not been reported from site testing of 8 m above the snow surface at Dome C. At local midnight, surface boundary layer temperature gradient weak Solar input poor seeing at surface • This is only consistent with our observations if the surface boundary layer is below the level of our telescope. We therefore conclude that our DIMM was above the surface boundary layer during these periods and was sampling the free atmosphere seeing. Case B)
2. Results 2.7 Diurnal variation for seeing We plotted all seeing data with the local time. Large seeing values Inside surface boundary layer Small seeing values Above SBL, or No SBL 0.2” 0 6 12 18 24 Local time (UTC+3) Lower limit of seeing ~0.2”can be observed every time except around local noon. This means that the free atmosphere seeing would be ~0.2”.
2. Results pppp… 2.8 SODAR To consider the turbulence above, we used SODAR data during 2006 to 2007 austral summer. SOnic Detection And Ranging ∝Turbulence strength V Takato (2008) SODAR can observe above from 40 to 400 m snow surface. Therefore SODAR cannot measure the strength of the surface boundary layer. Takato (2008)
2. Results 2.9 Considering SODAR results Convection by the solar heating Diurnal turbulence profile minimum height = 40m Integrate from 40 to 400m, • Turbulence within 40-400m would be caused by the convection by the solar heating. • Turbulence strength is almost constant except around local noon.
2. Results 2.10 Effect of convection Lower limit of the seeing value correlates with the turbulence strength within 40-400m. During 18h–6h (nighttime) Seeing value depends on the height of the surface boundary layer and its strength. We can obtain ~0.2” seeing when SBL is lower than the telescope. During 6h-18h (daytime) Convection by the solar heating makes worse the seeing value around local noon. Around 18h Seeing value tends to be small. No SBL and/or no convection.
3. Conclusion 3. Conclusion Model turbulence profile at Dome Fuji From our observations, we found that • thefree atmospheseeing is about0.2arcsecond • the height of the surface boundary layer can be as low as about 11 m. • the convection by the Sun makes worse the free atmosphere seeing at local noon Height Free Atmosphere ~10km 0.2” ~400m Convec-tion ~11m Surface Boundary Layer 0 12 24 hour