Download
1 / 43
430 likes | 573 Views
Lecture 9 Phylogenetic Prediction. Bioinformatics. Dr. Aladdin Hamwieh Khalid Al- shamaa Abdulqader Jighly. Aleppo University Faculty of technical engineering Department of Biotechnology. 2010-2011. Phylogenetic Trees and Dissimilarity estimation. Historical Note.

E N D
Lecture 9 • Phylogenetic Prediction Bioinformatics Dr. Aladdin Hamwieh Khalid Al-shamaa Abdulqader Jighly Aleppo University Faculty of technical engineering Department of Biotechnology 2010-2011
Historical Note • Until mid 1950’s phylogenies were constructed by experts based on their opinion (subjective criteria) • Since then, focus on objective criteria for constructing phylogenetic trees • Thousands of articles in the last decades • Important for many aspects of biology • Classification • Understanding biological mechanisms
Morphological vs. Molecular • Classical phylogenetic analysis: morphological features: number of legs, lengths of legs, etc. • Modern biological methods allow to use molecular features • Gene sequences • Protein sequences • DNA markers
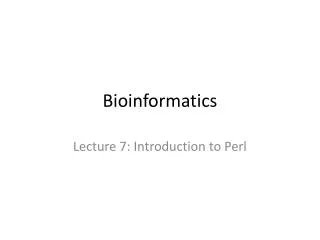
From sequences to a phylogenetic tree Rat QEPGGLVVPPTDA Rabbit QEPGGMVVPPTDA Gorilla QEPGGLVVPPTDA Cat REPGGLVVPPTEG There are many possible types of sequences to use (e.g. Mitochondrial vs Nuclear proteins).
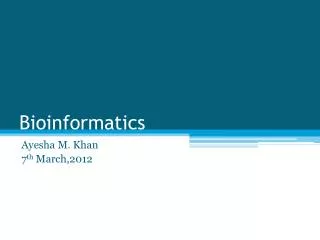
Aardvark Bison Chimp Dog Elephant Basic Assumptions • Closer related organisms have more similar genomes. • Highly similar genes are homologous (have the same ancestor). • Phylogenetic relation can be expressed by a dendrogram (a “tree”) . .
Dangers in Molecular Phylogenies • We have to emphasize that gene/protein sequence can be homologous for several different reasons: • Orthologs -- are genes in different species that have evolved from a common ancestral gene via speciation. • Paralogs-- sequences diverged after a duplication event • Xenologs-- sequences diverged after a horizontal transfer (e.g., by virus)
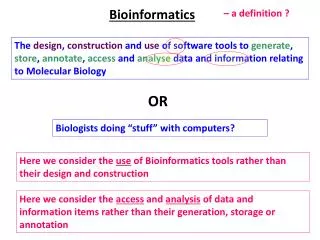
Gene Duplication Speciation events 2B 1B 3A 3B 2A 1A Species Phylogeny Gene Phylogenies Phylogenies can be constructed to describe evolution genes. Three species termed 1,2,3. Two paralog genes A and B.
Types of Trees A natural model to consider is that of rooted trees Common Ancestor
Types of trees Unrooted tree represents the same phylogeny without the root node Depending on the model, data from current day species does not distinguish between different placements of the root.
Distance-Based Method Input: distance matrix between species For two sequences si and sj, perform a pairwise (global) alignment. Let f = the fraction of sites with different residues. Then Outline: • Cluster species together • Initially clusters are singletons • At each iteration combine two “closest” clusters to get a new one (Jukes-Cantor Model)
UPGMA Step 1: Generate data (Sequence/ Genotype/ Morphological) for each OTU.
Step 2: Calculate p- distance for all pairs of taxa Distance can be calculated by using different substitution models: 1. # of nucleotide differences. 2. p-distance. 3. JC distance 4. K2P distance. 5. F81 6. HKY85 7.GTR etc = 0.142857143
Step 3: Calculate distance matrix for all pairs of taxa and select pair of taxa with minimum distance as new OTU. 0.0714 OTU-1 OTU-2 0.0714
Step 4: Recalculate new distance matrix, assuming OTU-1 and OTU-2 as one OTU. = 0.3571
Step 5: Select pair of taxa with minimum distance as new OTU. 0.071 OTU-1 0.107 0.071 OTU-2 0.179 OTU-3 0.107 + 0.071 + 0.179 = 0.357
Step 6: Again select pair of OTU with minimum distance as new OTU and recalculate distance matrix. = 0.5714
Step 7: Again select pair of taxa with minimum distance as new OTU. 0.071 OTU-1 0.107 0.071 OTU-2 0.107 0.179 OTU-3 0.286 OTU-4 0.107 + 0.107 + 0.071 + 0.286 = 0.571
Step 8: Again select pair of OTU with minimum distance as new OTU and recalculate distance matrix. = 0.7857
Step 9: Again select pair of OTU with minimum distance as new OTU and make final rooted tree. OTU-1 0.071 0.107 0.071 OTU-2 0.107 0.179 OTU-3 0.107 0.286 OTU-4 0.393 OTU-5 0.393 + 0.107 + 0.107 + 0.107 + 0.071 = 0.785
Jukes-Cantor distance the rate of nucleotide substitution is the same for all pairs of the four nucleotides A, T, C, and G A A A C A G A T C A C C C G C T G A G C G G G T T A T C T G T T 25% similar (= distance of 0.75). 75% which is what you expect with random assignment of nucleotides to a pair of taxa
تفترض طريقة UPGMA نسبة ثابتة في طول أفرع شجرة القرابة الوراثية =-(3/4)*LN(1-(((4/3)*0.1594)))
طريقة Neighbor-joining لا تعتمد طريقة فيتش-مارغولياش على استخدام نسبة ثابتة في طول أفرع شجرة القرابة الوراثية كما هي في طريقة UPGMA هذه الطريقة تعتمد على تحديد أقرب أزواج للوحدات المدروسة بأقل الأطوال للأفرع. ويمكن تعريف الزوج المقارب (Pair of neighbor) بأنه قيمة الارتباط بين وحدتين بعقدة غير جذرية (unrooted node). مثال: الإنسان والشيمبانزي متحدان في وحدة على عكس الأنسان والغوريلا وعليه ندعو الوحدة الأولى (الإنسان والشيمبانزي) على تجاور مع الغوريلا، وبعد دراسة القرابة بين الوحدة الأولى والغوريلا نبحث عن القرابة مع باقي أفراد المجتمع المدروس.
طريقة Neighbor-joining • مثال لدراسة ثمانية أفراد مدروسة: نبدأ المقارنة كما لو أنهم جميعا مرتبطون بعقدة واحدة، بعدها وعند إثبات الارتباط بين 1 و 2 تصبح الشجرة على
طريقة Neighbor-joining A:B = 0.015-(0.4010+0.35)/2
Example: =0.179/2+(0.18-0.245)/2 =0.179-0.057
Human and chimpanzee have the smallest value of Mij and they are replaced by node 2.
dij Mij
UPGMA • PHYLIP (Phylogeny Inference Package) • Neighbor-joining (NJ)
Genetic distance N= Fa+Fb+Fc+Fd Simple Match distance = Fa/N= 3/7= 0.43 Genetic distance (Jaccard) = Fa/(Fa+Fb+Fc) = 3/6= 0.5
Dissimilarity indices – Continuous Euclidean Distance is the most common use of distance. In most cases when people said about distance , they will refer to Euclidean distance. Euclidean distance or simply 'distance' examines the root of square differences between coordinates of a pair of objects. Euclidean distance
Dissimilarity indices – Continuous Example: Point A has coordinate (0, 3, 4, 5) and point B has coordinate (7, 6, 3, -1). The Euclidean Distance between point A and B is Euclidean distance
Manhattan (City-Block) It is also known as Manhattan distance, boxcar distance, absolute value distance. It examines the absolute differences between coordinates of a pair of objects.
Thank you PAST جلسة العملي تطبيق على برنامج