Download

1 / 5
50 likes | 139 Views
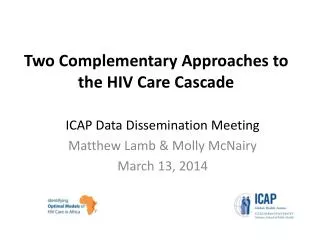
An Introduction to the Cascade of Care. Matthew Fox Center for Global Health & Development Department of Epidemiology Boston University Health Economics and Epidemiology Research Office July 25 th , 2012. WEAE0201 . How Do HIV Care and Treatment Programs Work?.

E N D
An Introduction to the Cascade of Care Matthew Fox Center for Global Health & Development Department of Epidemiology Boston University Health Economics and Epidemiology Research Office July 25th, 2012 WEAE0201
How Do HIV Care and Treatment Programs Work? Eligible for treatment Infected ART eligible Not ART eligible Disease Progression Tested, assessed, enrolled Eligibility established ART initiated (CD4 ≈ 200/350) Lifelong ART Pre-ART care Waiting Intended Program Progression Tested Eligibility established, enrolled ART initiated (CD4 ≤ 100) Lifelong ART Inaction Waiting Symptoms Actual Program Progression
Retention from Testing through 2 Years on ART Testing to Staging: 59% (range: 35-78%) Rosen PLoS Med 2011 Rosen PLoS Med 2007 Fox TMIH 2010 Staging to ART eligibility: 46% (range 31-95%) HIV+ diagnosed population CD4 results obtained (staged) Not yet ART eligible CD4 results not obtained (not staged) Pre-ART care until ART eligible Lost before ART eligible ART eligibility to ART initiation: 68% (range 14-84%) ART initiation through 2 years on ART: 60% - 70% Pre-ART estimates median retention 29% (18%1, 25%2, 33%3, 46%4) ART eligible Initiate ART On treatment through 2 years 1 Rosen & Fox, PLoS Med 2011 2 Mugglin CROI 2012 (1143) 3 Kranzer PLoS ONE 2010 Close AIDS Conference 2012 Lost before ART initiation Lost to follow up
Outcomes for Lost Patients On ART pre-ART Ingle et al. AIDS 2010 Brinkhof et al., PLoS One 2009
Insights • Full retention from testing to long-term care difficult to estimate • Limited data on retention among those not ART eligible at testing until ART eligible • Long term follow up data is needed • Need for investment in better information systems • Attrition from pre-ART care is highly problematic for earlier treatment initiation and treatment as prevention efforts • New strategies needed to reduce attrition