Download
1 / 28
280 likes | 407 Views
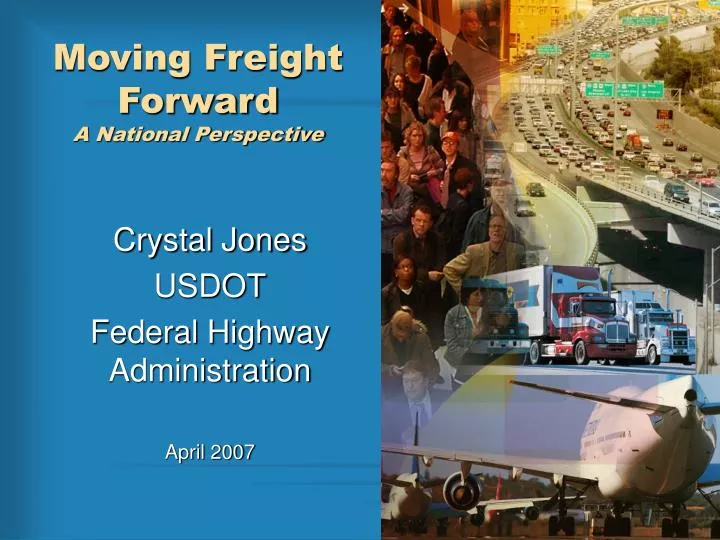
Moving Freight Forward A National Perspective. Crystal Jones USDOT Federal Highway Administration April 2007. Topical Outline. Context National Initiatives (US DOT) National Freight Policy Framework Congestion Initiative National Initiatives (FHWA). The Context.

E N D
Moving Freight ForwardA National Perspective Crystal Jones USDOT Federal Highway Administration April 2007
Topical Outline • Context • National Initiatives (US DOT) • National Freight Policy Framework • Congestion Initiative • National Initiatives (FHWA)
The Context • 25% of the U.S. GDP is related to international trade and is predicted to grow to 35% in the next 20 years. • US/Canada/Mexico = largest world trading relationship • $2.2 Billion in trade/day • 2 Million people legally cross/day • From 1980 to 2002, truck travel on US highways grew by 90% while lane-miles of public roads grew by only 5%. • Between 1998 and 2020, the percentage of urban interstates carrying 10,000 or more trucks will increase from 27% to 69%. • U.S. rail traffic is at or near segment capacity in intermodal corridors and new tracks are not being laid down. • Potential investment in capacity expansion and operational improvement (including ITS applications) will have to compete with existing infrastructure maintenance and improvement • Congestion impedes timely and reliable freight movements and threatens business productivity.
Framework for a national freight policy Vision Vision Objectives Objective 1 Objective 2 Objective 3 Objective 4 Objective 5 Objective 6 Objective 7 Strategies Tactics Activities
Freight policy objectives • Improve the operations of the existing freight transportation system • Add physical capacity to the freight transportation system in places where investment makes economic sense • Use pricing to better align all costs and benefits between users and owners of the freight system and to encourage deployment of productivity-enhancing technologies • Reduce or remove statutory, regulatory, & institutional barriers to improved freight transportation performance • Proactively identify and addressemerging transportation needs • Maximize the safety and security of the freight transportation system • Mitigate and better manage the environmental, health, energy, and community impacts of freight transportation
Overarching themes • Framework for national, notFederal, freight policy • Importance of investment • Value of public-private collaboration • Living document • Need for accountability
National Strategy to Reduce Congestion on America’s Transportation Network “Mobility is one of our country’s greatest freedoms, but congestion across all of our transportation modes continues to limit predictable, reliable movement of people and goods, and poses a serious threat to continued economic growth. Congestion no longer affects only roads in larger urban areas, but is spreading across America.” • Secretary Mary Peters, October 2006 “Congestion is not a fact of life. We need a new approach and we need it now.” - Former Secretary Norman Mineta, May 2006
The Big Picture • Cost of highway congestion in 2003 • 3.7B hours of travel delay, and 2.3B gallons of wasted fuel… • …for a total cost of $63B • Total costs would be much higher if unreliability, inventory and environmental costs (among others) were included • Cost of aviation congestion • Annual commercial airline passenger delays amount to $9.4B in U.S. delay costs
Cost of Congestion to U.S. Businesses National retailer keeps $2.5B merchandise on-hand, but adds 10days of “buffer stock” to its inventory due to rail delays. Additional stock costs $2.7M annually. In 2000, congestion at the Ambassador Bridge between Detroit, Michigan and Windsor, cost motor carriers between $150M and $200M. In 2005, congestion at the Otay Mesa and Tecate crossings, along the California-Mexico border, cost the U.S. economy $3.7B in output and almost 40,000 jobs. Atlanta area distributor of pet food with an 11-truck fleet finds it difficult for one truck to make more than 12 daily deliveries; in 1984, one truck made as many as 20 deliveries each day.
Cost of Congestion in Wasted Time and Fuel in the Largest Urban Areas
Why Now? • Surging public discontent with congestion and “pork” barrel spending • New advances in technology that can greatly improve system management and pricing • Successful congestion reducing demonstrations in major cities around the world • Strong private sector investment interest in U.S. infrastructure • Growing consensus that traditional financing mechanisms for highway and aviation infrastructure are unsustainable • Economic benefits of trucking, rail and aviation deregulation (estimated at $60B/year) increasingly threatened
A Six Point Plan • Execute “Urban Partnership Agreements” with 1-5 major metro areas • Encourage States to consider enacting public private partnership laws • Develop new interstate highway and rail capacity through a “Corridors of the Future” competition • Reduce bottlenecks at major freight gateways, including Southern California • Find and implement solutions to border congestion • Accelerate major airport capacity projects, reform airport pricing policies and overhaul the air traffic control system
FHWA - Office of Freight Management and Operations – Objectives • Understand the magnitude and geography of freight moving on the nation’s transportation system, including international freight • Develop strategies, analytical tools, institutional arrangements, and professional capacities for all levels of government to address freight movement • Understand and promote the economic benefits of freight transportation • Encourage innovative freight technology & operations • Enforce commercial vehicle size and weight requirements
Freight Analysis Framework (FAF) • Commodity flows by origin and destination for truck, rail, and water in 1998, 2010, 2020 • Planned improvements: update base year to 2002 Economic Census, improve coverage, identify hazmat flows, time of day estimates, provisional estimates of current year freight activity, etc. • Applications: policy-sensitive mode split model, links to policy models, scenario forecasts • Assure continuation of data sources and explore new data sources
Freight Analysis Framework (FAF2) Origin-Destination Database: 106 CFS regions plus international gateways 2002 benchmark Forecasts for 2010, 2015, …, 2035 Annual provisional estimates Network Flow Database 2002 benchmark, forecasts, annual provisional estimates Maintain and improve source data and look for new sources CFS, ITDS Development of local knowledge encouraged in lieu of dependence on default values from national surveys and overextended models.
Freight Performance Measurement Strategic Objective - Global Connectivity “Facilitate a more efficient domestic and global transportation system that enables economic growth and development” Desired Outcomes • Reduce transportation-related barriers to traded • More efficient movement of cargo throughout the supply chain Goals • To reduce travel time in key highway freight corridors. • To reduce delays of commercial vehicles processed at • National Highway System border crossings Outcome Measures • Travel Time and Reliability on Freight Significant Highways • Border Crossing Time
Freight Performance Measurement • What? • Methodology use Trucks as Probes • Automatic Vehicle Location(AVL)/Satellite Technology • GPS Coordinates (Date and Time Stamped) • Unique Carrier ID • How? • Partnership with American Transportation Research Institute, a Satellite Technology Vendor and Carriers • Data Cleansing techniques allows collection of collection data from all/most of the vendor’s carrier subscribers (~250,000 vehicles)
Freight Performance Measurement • Where? • 25 Major US Interstates • Land Border Crossings • 5 US/Canada Crossings • US/Mexico under development • Application of Results • Provides a quantifiable basis to engage public and private sector and investigate and explore causes of delay • One of several analytical tools that helps get us to solutions – target resources where greatest needs exists
FPM Border Component • Data Collection Began 7/01/05 for 5 Crossings • Blaine (Pacific Highway): Blaine, WA • Pembina: Pembina, ND • Ambassador Bridge: Detroit, MI • Peace Bridge: Buffalo, NY • Champlain: Champlain, NY • Effort looks at crossings as well as transportation network that supports the crossings
Freight Professional Development • Section 5204: Training and Education • (h) Freight Planning and Capacity Building Program • Courses, seminars & workshops • Congestion Mitigation Strategies for Urban Goods Movement (seminar) • Freight and the Environment (course) • Uses of Multimodal Freight Forecasts in Transportation Planning (course) • Engaging the Private Sector in Transp. Planning (workshop) • Peer-to-peer exchange • Talking Freight • Public sector activity in academic curriculum
SAFETEA-LU Freight Provisions • Section 1301: Projects of National and Regional Significance • Section 1302: National Corridor Infrastructure Improvement Program • Section 1306: Freight Intermodal Distribution Pilot Grant Program • Section 5209: National Cooperative Freight Transportation Research Program
Key Take-Aways • The national economy is reliant on a functional transportation network. • Today's intermodal freight system is not equipped to handle predicted growth • System deficiencies increase operating costs and congestion, and decrease safety, economic competitiveness, and environmental quality • Keeping freight moving requires coordination and collaboration among varied private and public stakeholders at the international - national – regional – state – local levels
Additional Information at: National Policy Framework http://www.dot.gov/freight/ Congestion Initiative http://www.fightgridlocknow.gov/ FHWA Freight Programs http://www.ops.fhwa.dot.gov/freight