Download
1 / 22
220 likes | 342 Views
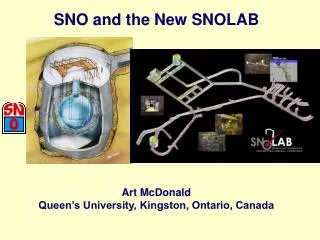
Clean Fabrication and Cleanliness Monitoring in SNO. Doug Hallman Laurentian University for the SNO Collaboration. The SNO Experiment:

E N D
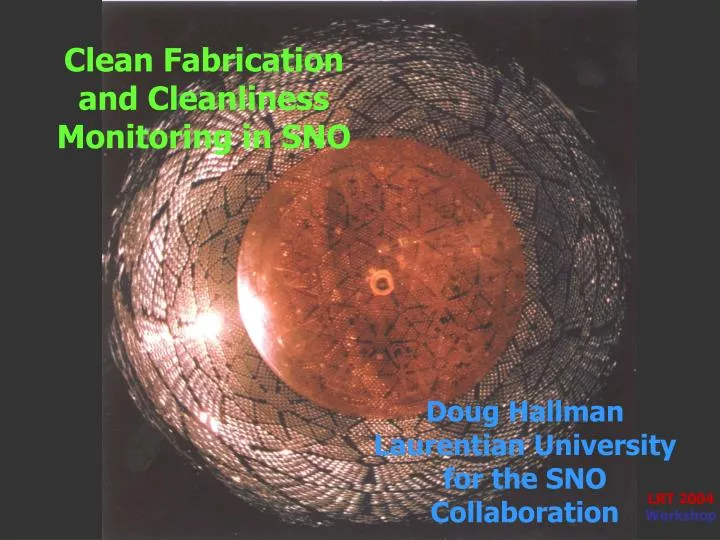
Clean Fabrication and Cleanliness Monitoring in SNO Doug Hallman Laurentian University for the SNO Collaboration LRT 2004 Workshop
The SNO Experiment: • required achieving of threshold of 5 MeV or less for SNO’s detection reactions and -ray and neutron backgrounds small compared to the neutral current signal rate. • materials and components for SNO were monitored for radio-impurities in a variety of ways (including direct -ray counting, NAA radon emanation etc.) and often tested and assembled in clean room facilities at SNO institutions. Can’t review all of this work here. • the building of the phototube sphere and the acrylic vessel were complex tasks requiring many months of work. It was decided that the whole laboratory would be made a clean room facility, with personnel taking showers and changing to clean room coveralls on entry. LRT 2004 Workshop
General Cleanliness Principles: • isolate the laboratory from the mine, using a car wash, a special personnel entry area, and thorough air filtering. • make cleanliness in lab entry, housekeeping and procedures a very high priority for personnel. • wherever possible, deliver clean materials in “blue box” containers to the lab and monitor the cleanliness before use in the laboratory or detector. • maintain cleanliness during the detector operations phase by constant monitoring and air systems maintenance. Materials to be installed in the D2O are checked for surface dust levels. • provide extra isolation for critical areas (e.g. at the neck entry to the acrylic vessel – Deck Clean Room). LRT 2004 Workshop
Establishing Cleanroom Conditions (1994): • cavern wall coating completed ( 1 cm polyurethane sprayed on smoothed concrete layer over the rock). • laboratory rooms painted and cleaned. • air handling system completed and cleaned. • operating procedures – showers and cleanroom coveralls for personnel, materials delivered in clean state (“blue boxes”) or cleaned in carwash. • Critical Detector Assembly Operations: • installation of the photomultiplier tube panels in the spherical PSUP (several years before operations phase). • installation and bonding of acrylic vessel panels/chimney. • materials carefully selected, special high purity production runs. LRT 2004 Workshop
Sudbury Neutrino Observatory Cleanroom Systems • Air Handler cooler/filter Units (1 - 5) • high circulation (10 air changes/hr) • 10 years successful operations experience • cleanliness measures include regular filter maintenance, lab cleaning, showers for personnel & materials entry control Water processing area 1 Deck cleanroom CLASS 200 air < 0.05 g dust/sq.cm./month 2 Corridor CLASS 2000 air < 0.1 g dust/sq.cm./month Control room 4 3 Mine drift CLASS 1,000,000 air SNO detector deck area 5 Lab entry & carwash CLASS 5000 air < 1 g dust /sq.cm./month Personnel change & shower area • unique XRF technique developed • to monitor dust deposition and surfaces LRT 2004 Workshop
LRT 2004 Workshop
SNO Detector Assembly: - March 1990 – May 1993 – excavation - Nov. 1994 – start of clean assembly - Aug. 1995 – Nov. 1997 – acrylic vessel, photo tube sphere installed - April 1998 – start of water fill - May 1999 – start of measurements Monitoring during construction: Air particle counts: < CLASS 10,000 Dust Deposition: a few g/cm2 /month in the cavern LRT 2004 Workshop
Dust Monitoring – the SNO X-ray Fluorescence Method • We use a small XRF spectrometer (from Lawrence Berkeley National Laboratory), developed for environmental air particulate monitoring, for this purpose. • SNO’s underground XRF application was developed by Robert Stokstad of LBNL. It is based on the 7% iron content of “mine dust” in the Creighton mine – dust with significant iron content is assumed to be “mine dust” and to contain about 1 ppm U and 5 ppm Th. Other dust sources containing significant element components can also be measured. • Sensitivity – 0.02 g/cm2 “equivalent mine dust” – can distinguish Fe from stainless steel vs. Fe in mine dust, by presence of other metals (e.g. Ni, Cr) in SS samples. • We monitor dust deposition in critical lab areas and surface cleaning of components during assembly. LRT 2004 Workshop
Equivalent mine dust deposition (g/cm2) Time (months) • witness plate foils monitor dust deposition from the air. We follow dust deposition on a single foil for many months to find rate. Here the deposition is 0.10 0.03 g/cm2/month Zinc deposition (g/cm2) LRT 2004 Workshop SNO carwash corridor
SNO Acrylic Vessel Construction Dust deposition rates gave estimates of possible dust quantity on bond surfaces (when open to air). Tape lifts established the final cleanliness state of the vessel surfaces after cleaning. Example: After cleaning, equivalent mine dust levels were For vessel interior – 34 lifts – avg. 0.007 0.039 g/cm3 For vessel exterior – 35 lifts – avg. 0.030 0.034 g/cm3 For the 1000 m2 total surface area, the upper limit is 0.11 g x 107 cm2 = 1.1 g (equiv. mine dust) LRT 2004 Workshop
SNO Detector Operations: cleanliness in the detector operations phase. control of cleanliness for equipment/materials inserted in the SNO detector core. cleanliness during the construction and installation of the Neutral Current Detectors. LRT 2004 Workshop
Examples of Routine Monitoring in Operations Phase (with H.C. Evans, P. Skensved, Queen’s U., C. Woodliffe, SNO) • Umbilical Cord for calibration devices in the D2O. Tape lifts are used when a new cord is installed or major changes made. Further cleaning is performed if tests show it is needed. A standard of 0.50 g/cm2 has been adopted for equipment inserted in the D2O. • Tape lift 1 (initial condition) – 0.95 g/cm2 “mine dust” Tape lift 2 (after wash & rinse) – 0.25 g/cm2 “mine dust” • Stainless steel Fittings – some steel particles are lifted by tape – signal is typically 60% Fe, 30% Cr and 10% Ni for these – Fe in excess of this is attributed to mine dust. • Neutral Current Detector Tubes – these vapour-deposited nickel tubes typically show tape lift removal of Ni at about 0.2 to 0.8 g/cm2. Dust can still be detected (using the Fe signal) down to < 0.1 g/cm2 levels. LRT 2004 Workshop
SNOLAB Phase II SNOLAB Phase I Existing SNO Facility Clean/Dirty Boundary Relocated The Underground Lab LRT 2004 Workshop
Change Rooms, Showers Lunch Room Carwash (Equipment Entry Personnel Entry Lab Entry LRT 2004 Workshop
SNO Utility Drift South Drift SNO Cavern 70' diameter x 100' height SNO Cavern and South Drift LRT 2004 Workshop
Ventilation: Cleanliness • Existing SNO facility is ~class 2000 • Goal for the new facility is to be as good or better. • Air from labs will be locally recirculated through HEPA filters LRT 2004 Workshop
Ventilation: Air Handlers LRT 2004 Workshop
Ventilation: Pressure Zones LRT 2004 Workshop
Surface Facility LRT 2004 Workshop
Surface Facility: Ground Floor Development Labs CLASS 5-10,000 10 air changes/hr Clean Assembly Area CLASS 2,000-3000 (30 air changes/hr) LRT 2004 Workshop
LRT 2004 Workshop Construction Progress Nov. 30 – completion June 2005
Cleanliness Monitoring and Clean Assembly – the Future • Special cleanroom areas such as the SNO deck cleanroom can reduce dust deposition by factors of 10 and provide further isolation from underground environments. These should become more necessary & common. • Where a suitable element tracer is available, the XRF technique can be extended to provide in situ measurements of surface dust down to possibly 10 ng/cm2. • Concerns about deposition of radionuclides such as 210Pb will necessitate more extensive cleaning and wrapping/protection steps and more use of radon-free conditions where possible. • a SNO reference: Nucl. Inst. Meth. A 449 (2000) pp 172-207 LRT 2004 Workshop