Download
1 / 24
240 likes | 400 Views
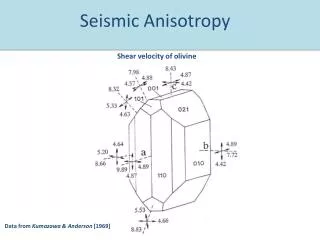
Krakow Agriculture University. VELOCITY PROFILE AND SHEAR STRESSES CALCULATION IN HIGH VOLUME RELATIVE BED ROUGHNESS FLOW. Wojciech Bartnik Andrzej Struzynski. Presentation Schedule. Flow zones – Introduction Laboratory measurements Bed roughness measurements Log-law velocity distribution

E N D
Krakow Agriculture University VELOCITY PROFILE AND SHEAR STRESSES CALCULATION IN HIGH VOLUME RELATIVE BED ROUGHNESS FLOW Wojciech Bartnik Andrzej Struzynski
Presentation Schedule • Flow zones – Introduction • Laboratory measurements • Bed roughness measurements • Log-law velocity distribution • Calculation of velocity and shear stresses • Conclusions
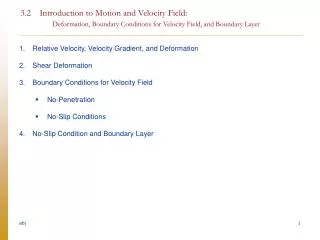
Flow zones Bed roughness and water surface acts on the flowing water
Flow zones • I - laminar flow • II - log-law velocity distribution • III - wake region • IV - free surface region
IV III II I Flow zones • flat bed
IV Flow zones • rough bed IV III II I
Flow zones [Williams J.J., 1996]
Flow zones Bed roughness and water surface acts on the shape of flowing water velocity profile.
Flow zones Fr = 0.074 Fr = 1.38 The shape of velocity profile depend on: flow depth, av. velocity of flowing water, bed roughness, relative roughness ... For hydraulically rough flow conditions I and IV flow zone decreases 4D
Laboratory measurements • Flume dimensions: l2.0 x 0.5 x 0.6 m (glass walls) • Flume rig: • micro-propeller • flow-meter • slope measurements • Bed slope, water surface slope • Discharge: max 0.13 qm s-1 • Artificial grains Ø – 4 to 8 cm
Bed roughness measurements homogeneous roughness ks = K (1.926 SF2 – 0.488 SF + 4.516) Profile-meter AG-1
Log-law velocity distribution flat bed Maximum velocity moves with relative roughness change
Log-law velocity distribution rough bed Maximum velocity moves with relative roughness change
Log-law velocity distribution flat bed For the same bed roughness curves are parallel
Log-law velocity distribution grains 4M For the same bed roughness curves are parallel
Log-law velocity distribution grains 4D For the same bed roughness curves are parallel
Log-law velocity distribution grains 6D For the same bed roughness curves are parallel
Log-law velocity distribution grains 8D For the same bed roughness curves are parallel
Calculation of velocity and shear stresses Modified Prandtl equation Log-law velocity distribution for whole profile is used U/Umax = A log (y/Y) + B B becomes constant- B = 1.12±3%
Calculation of velocity and shear stresses U/Umax = A log (y/Y) + B A value changes with relative depth Y/K
Calculation of velocity and shear stresses U/Umax = A log (y/Y) + B Comparison of measured to calculated A constant
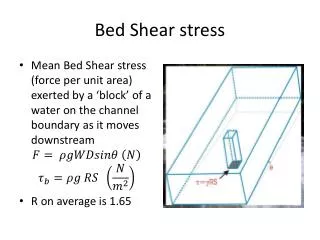
Calculation of velocity and shear stresses Velocity profile reflects shear stresses Use of logarithmic equation allow calculating t0 for rough flow conditions t0 = 2.303 K UM
Conclusions • Near bed the velocity and velocity profile slope calculations (in logarithmic scale) are correct within the second and third flow zone. The use of equation (4) makes the bed level (zero velocity) estimation error negligible (B=1.12). • The use of mentioned method is limited to the rough flow conditions where the maximum velocity lays close to the water surface (the near surface region decreases to 20% of water depth). • The measurements of surface velocity, water depth and bed roughness can be used for calculation of water velocity profile and bed shear stresses for rough flow conditions.