Download
1 / 22
220 likes | 299 Views
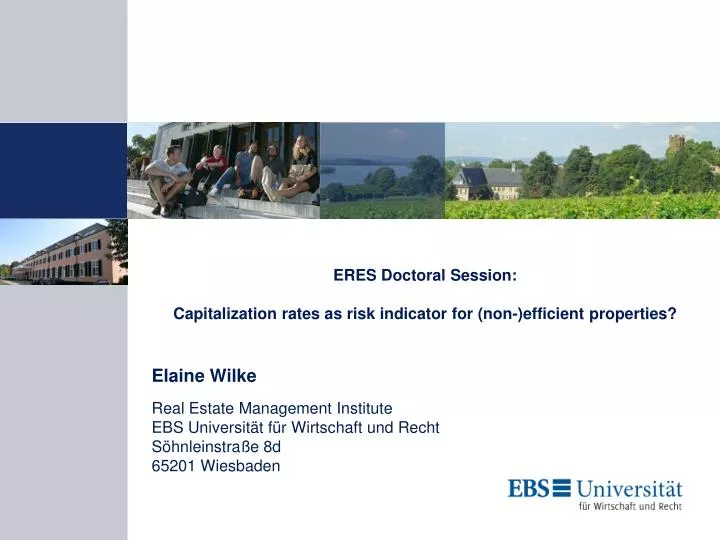
ERES Doctoral Session: Capitalization rates as risk indicator for (non-)efficient properties?. Elaine Wilke Real Estate Management Institute EBS Universität für Wirtschaft und Recht Söhnleinstraße 8d 65201 Wiesbaden.

E N D
ERES Doctoral Session:Capitalization rates as risk indicator for (non-)efficient properties? Elaine Wilke Real Estate Management Institute EBS Universität für Wirtschaft und Recht Söhnleinstraße 8d 65201 Wiesbaden
Agenda:Capitalization rates as risk indicators for (non-) efficient properties? 1.0 Introduction / Research objective 2.0 Data and Research Method 3 .0 Results 4.0 Conclusion Elaine Wilke REMI, 2010-06-23
1.0 Introduction • Risk of (non-)efficient properties • so far only research and publications from the investors’ perspective • But: most sustainability aspects influence the operating and occupancy costs of the occupier; • these costs are not taken into consideration when calculating the NOI • how are the results going to change if also the occupiers’ goals are considered? • investors: higher net rents and/or higher returns • occupiers: reduced operation and occupancy costs • both perspectives interact in the valuation process: • sustainable (efficient) properties realize higher Capital Values than non-sustainable (efficient) properties, • as sustainability (efficiency) reduces the property specific risk • Hypothesis: • The capitalization rate as all risks yield interacts as indicator for the risk of (non-) efficient properties • higher risk premiums for non-efficient properties! Elaine Wilke REMI, 2010-06-23
Capitalization rates as risk indicators for (non-) efficient properties? 1.0 Introduction / Research objective 2.0 Data and Research Method 3 .0 Results 4.0 Conclusion Elaine Wilke REMI, 2010-06-23
2.1 Data • Data from Investors and Occupiers: • IPD Investment Property Databank UK • IPD Occupiers Databank UK • Sample size n = 47 objects (in both databanks for 2007 and 2008) Elaine Wilke REMI, 2010-06-23
2.2 Research Method • Partial Least Squares (PLS) – method • (according to Wold) • causal relationships between (in)dependant (latent) variables • also available for smaller sample sizes • any measurement levels • separate calculation for 2007 and 2008 • Illustration of the cause-effect relations • (directions and sings) between the hypothesis • and the latent variables. Elaine Wilke REMI, 2010-06-23
2.3 Base Model Block 2 Model latent exogenous variable Reflective Structure Model latent exogenous variable Reflective Structure Block 3 Block 1 Block 4 Model latent exogenous variable Formative Structure Model latent endogenous variable Reflective Structure Elaine Wilke REMI, 2010-06-23
2.4 Indicators Elaine Wilke REMI, 2010-06-23
2.4 Indicator - Total Operating Costs per sqm IPD International Total Occupancy Cost Code (ITOCC): • Elements of the IPD Total Operating Costs per sqm: • consolidated service charge • insurance • internal repair and maintenance • M&A repair and maintenance • external/structural repair and maintenance • minor improvements • internal moves • reinstatement • security • cleaning • waste disposal • internal plants and flowers • ground maintenance • water, sewerage • energy Source: IPD ITOCC 4th edition Elaine Wilke REMI, 2010-06-23
Capitalization rates as risk indicators for (non-) efficient properties? 1.0 Introduction / Research objective 2.0 Data and Research Method 3 .0 Results 4.0 Conclusion Elaine Wilke REMI, 2010-06-23
3.1 Base Model (2007) R² Elaine Wilke REMI, 2010-06-23
3.1 Base Model (2007) • Model quality criteria: • AVE > 0.5 • Composite Reliability > 0.7 • Cronbach‘s Alpha > 0.7 • Modification of the model! Elaine Wilke REMI, 2010-06-23
3.2 Model – modified (2007) R² • AVE > 0.70 • Composite Reliability > 0.7 • Composite Reliability > Cronbach‘s Alpha • Cronbach‘s Alpha ~ 0.7 Elaine Wilke REMI, 2010-06-23
3.2 Model – modified (2007) Discriminant Validity • Outer Loadings > 0.7 • support validation of reflective model • Cross Loadings < Outer Loadings • no multicollinearity • degree to which two measures designed to measure similar or conceptually related constructs: • √AVE > Latent Variable Correlation • no relation Elaine Wilke REMI, 2010-06-23
3.2 Model – modified (2007) - Bootstrapping • Estimating the distribution of the statistic by using the bootstrapping method • The calculation is based on 300 cases and 500 samples • standard errors with values < 0.04 suggest a low level of uncertainty • T Statistics indicate a good fit of the model explaining the degree of variability of the dependent • variable Elaine Wilke REMI, 2010-06-23
3.2 Model – modified (2007) R² = 27,53% GoF = 0,401 • bigger role in explaining than in predicting as q² <f² • The effect size (f²) with a value of 0.088 has to be interpreted according to Cohen as a • low to medium effect with f² <0.15. • Q² with 0.267 implies predictive relevance • The calculated GoF (.401) is higher than the marginal value of > .275 indicating that the • model strongly fits the set of observations. Elaine Wilke REMI, 2010-06-23
3.3 Model – modified (2008) R² • AVE ~ 0.70 • Composite Reliability > 0.7 • Composite Reliability > Cronbach‘s Alpha • Cronbach‘s Alpha ~ 0.7 Elaine Wilke REMI, 2010-06-23
Capitalization rates as risk indicators for (non-) efficient properties? 1.0 Introduction / Research objective 2.0 Data and Research Method 3 .0 Results 4.0 Conclusion Elaine Wilke REMI, 2010-06-23
4.0 Conclusion Elaine Wilke REMI, 2010-06-23
4.0 Base Model Block 2 Model latent exogenous variable Reflective Structure Model latent exogenous variable Reflective Structure Block 3 Block 1 Block 4 Model latent exogenous variable Formative Structure Model latent endogenous variable Reflective Structure Elaine Wilke REMI, 2010-06-23
4.0 Conclusion • so far only minor consideration of property characteristics in the derivation of the cap rate • changes in the (economic) environment dominate the choice of the risk premium • no integration of use efficiency • occupiers’ perspectives are ignored • future consideration of (non-)efficiency ? • review of the interrelations with bigger sample sizes Elaine Wilke REMI, 2010-06-23
Capitalization rates as risk indicators for (non-) efficient properties? Thank you! Elaine Wilke REMI, 2010-06-23